Figure 5.

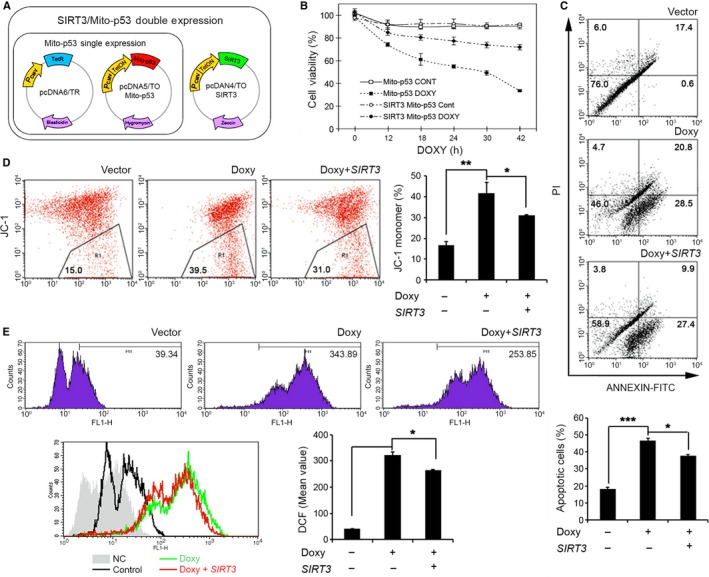
SIRT3 prevents mito‐p53‐induced mitochondrial dysfunction and neuronal death. (A) A scheme shows SIRT3/mito‐p53 double expression cell model. (B) SIRT3 improved mito‐p53‐induced cell viability. SIRT3/mito‐p53 double or mito‐p53 single inducible cell lines were treated with or without 2 μg mL−1 DOXY for 0, 12, 18, 24, 30, and 42 h, respectively. Cell viability was analyzed by MTT assay. (C) Ectopic expression of SIRT3 prevented mito‐p53‐induced apoptosis. Apoptotic cells were analyzed by flow cytometry after Annexin V/ PI staining in mito‐p53‐inducible cell with or without SIRT3 overexpression. The bar graph data (bottom panel) represents the mean ± SEM (n = 3; *P < 0.05, ***P < 0.001). (D) SIRT3 improved mito‐p53‐induced mitochondrial membrane potential (Ψ) loss. Mitochondrial membrane potential was detected by flow cytometry after JC‐1 staining in mito‐p53‐inducible cell with or without SIRT3 overexpression. The bar graph data represent the mean ± SEM (n = 3; *P < 0.05, **P < 0.01). (E) Ectopic expression of SIRT3 reduced mito‐p53‐induced ROS production. Reactive oxygen species (ROS) were analyzed by flow cytometry after DCF staining in mito‐p53‐inducible cell with or without SIRT3 overexpression. The bar graph data represent the mean ± SEM (n = 3; *P < 0.05).
