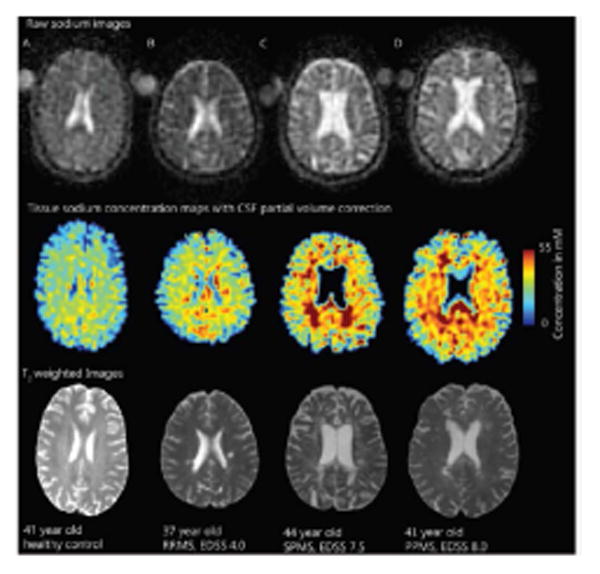
Fig. 4.

Global 23Na concentration across MS phenotypes. Raw 23Na images in 23Na space (top), tissue 23Na maps with CSF partial volume correction (middle) and T2-weighted images (bottom) registered to the T1 volumetric scan in controls (A) and patients with MS (B-C-D). Increased 23Na is seen in relapsing remitting- MS patients lesions (B) and, more extensively, in lesions and normal appearing white matter of secondary- (C) and primary- (D) progressive MS patients. Reproduced from Paling et al.2013 by permission of Oxford University Press.
