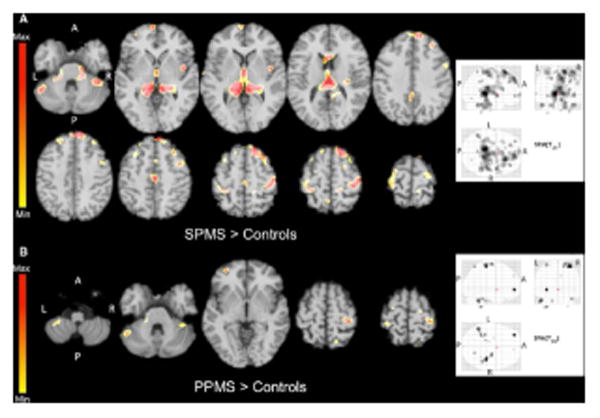
Fig. 5.

Statistical mapping of TSC increases in secondary progressive MS patients relative to controls (A) and in primary progressive MS patients relative to controls (B). In order to reduce CSF contamination grey matter, normal appearing white matter and T2 lesion masks were applied onto the co-registered quantitative sodium concentration maps to obtain TSC distribution maps of each compartment for each patient. Reproduced from Maarouf et al. 2013 by permission of Springer Ltd.
