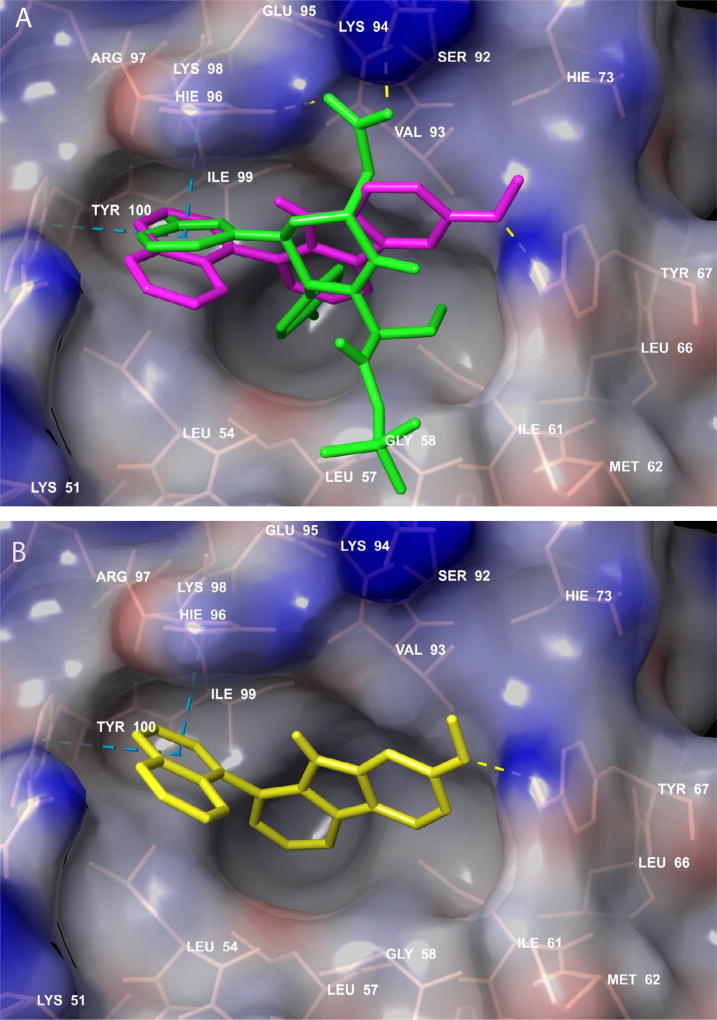
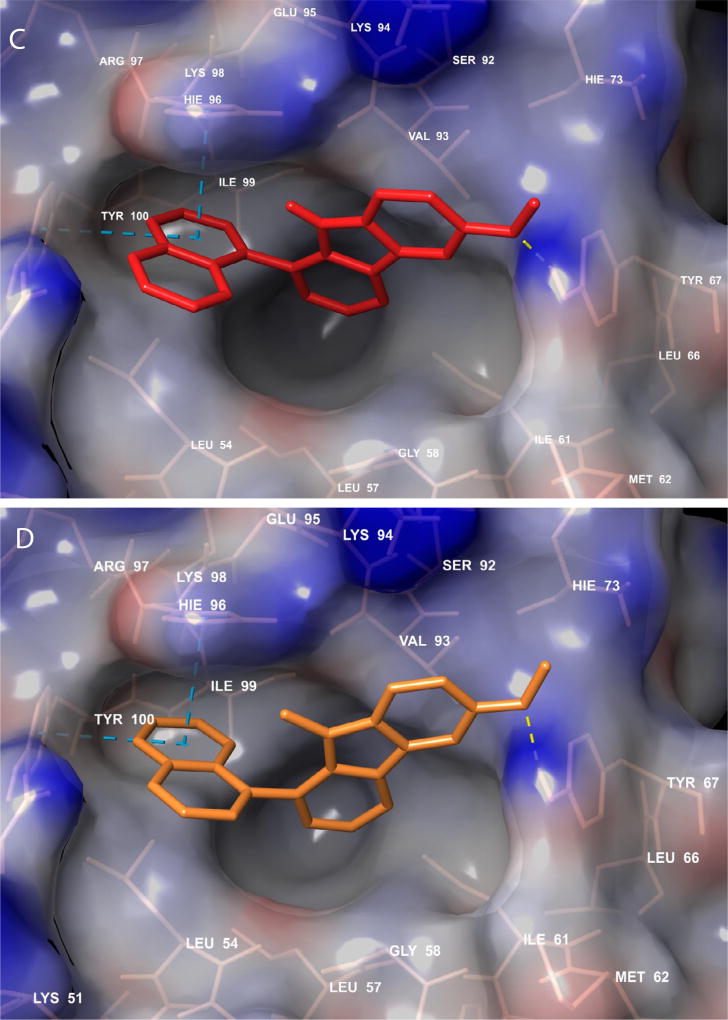
Figure 4.
Docking poses of a known MDM2 inhibitor oxopiperidine derivative and representative compounds. (A) Pose of of compound 11 (magenta) superimposed on the docking pose of oxopiperidine derivative (green), in the p53 binding site on MDM2; (B) Docking pose of compound 2 (yellow); (C) docking pose of compound 12 (red); and (D) docking pose of compound 49 (orange). The protein surface was mapped to electrostatic potential using a red- white-blue color scheme (−0.3: minimum (red) and +0.3: maximum (blue). Active site residues interacting with the compounds are shown in pink stick rendering. Pi-pi interactions are shown by cyan dashed lines, while hydrogen bonding between the compounds and the protein is indicated by yellow dashed lines.


