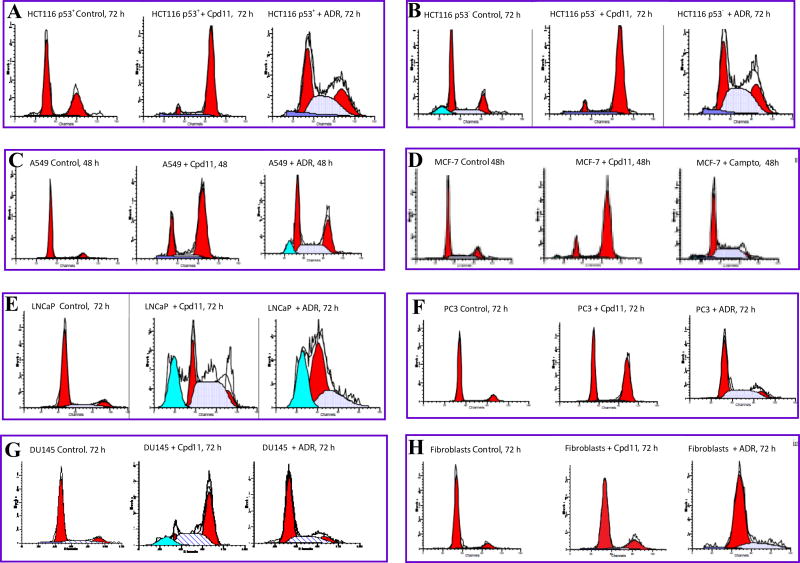
Figure 5.
Representative flow cytometric histograms showing effects on various human cancer cell cycles or the cell cycle of normal cells upon treatment with compound 11 (Cpd11). The panels are: (A), HCT116 p53 positive (p53+) colon cancer cell line; (B), HCT116 p53 negative (p53−) colon cancer cell line; (C), A549 lung cancer cell line; (D), MCF-7 breast cancer cell line; (E), LNCaP prostate cancer cells; (F), PC3 prostate cancer cells; (G), DU145 prostate cancer cells; (H), normal human skin fibrobrasts. Cells were exposed to 10 µM of Cpd11 or vehicle (control) or a chemotherapy agent Adriamycin (ADR) or Camptothecin (Campto) as standard control. The left red peaks represent cells in the G0/G1-phase of the cell cycle, the right red peaks represent G2/M cells, and the area in between them represents cells in the S phase. The cyan peak indicates sub G0 apoptotic peak.

