
Extended Data Figure 1. Activation of mitosis and mitochondria by F3-T3.
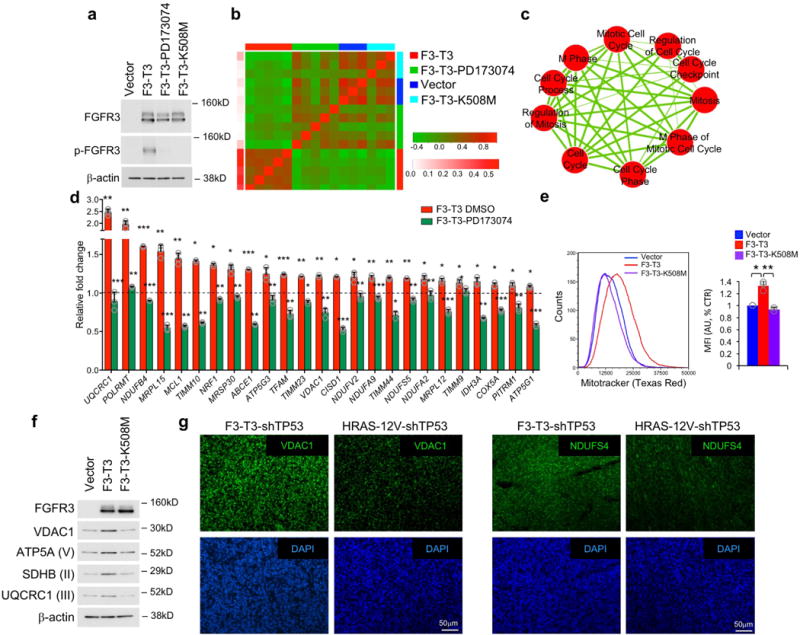
a, Immunoblot analysis of FGFR3 and p-FGFR3 in HA-F3-T3 treated with DMSO or PD173074, HA-F3-T3-K508M and HA-vector. β-actin is shown as loading control. Experiment was repeated at least five times with similar results. b, Heatmap of correlations among HA-F3-T3, HA-F3-T3 treated with PD173074, HA-vector and HA-F3-T3-K508M. Upper and right track colors represent sample type; left track color scale represents correlation between each sample and the F3-T3 group. HA-F3-T3, HA-F3-T3-PD173074 (n=5 biologically independent samples per group). HA-vector and HA-F3-T3-K508M (n=3 biologically independent samples per group). c, Enrichment map network of GO categories scoring as significant (q-value <10E-6 in each comparison, NES >0.6, two-sided Mann-Whitney-Wilcoxon test) from three independent gene set enrichment analyses (F3-T3 versus F3-T3-PD173074; F3-T3 versus F3-T3-K508M; F3-T3 versus vector). Nodes represent GO terms and lines indicate their connectivity. Size of nodes is proportional to enrichment significance and thickness of lines indicates the fraction of genes shared between the groups. d, qRT–PCR from HA-vector or HA-F3-T3 treated with vehicle (DMSO) or PD173074 for 12 h. Data are fold changes relative to vector (dotted line) of one representative experiment out of two independent experiments (data are Mean ± s.d., n=3 technical replicates). P-values were calculated using a two-tailed t-test, unequal variance. P: * <0.05; **<0.01; ***<0.001. For complete list of P-values refer to Excel source data. e, Analysis of mitochondrial mass by MitoTracker FACS analysis in HA-F3-T3, F3-T3-K508M or vector (left panel). Right panel, quantification of MFI. Data are Mean±s.d. of three (vector and F3-T3) and two (F3-T3-K508M) independent experiments; P: * <0.05; **<0.01, two-tailed t-test, unequal variance. f, Immunoblot analysis of mitochondrial proteins in HA-F3-T3, HA-F3-T3-K508M and HA-vector. Experiment was repeated independently three times with similar results. g, Representative microphotographs of VDAC1 and NDUFS4 immunofluorescence (upper panels, green) in mGSC-F3-T3-shTP53 and mGSC-HRAS-12V-shTP53. DAPI staining of nuclei is shown as an indication of cellular density (lower panels, blue). Experiment was repeated independently two times with similar results. Molecular weights are indicated on all immunoblots.