
Figure 2. Phosphorylation of PIN4 at Y122 affects mitochondrial metabolism.
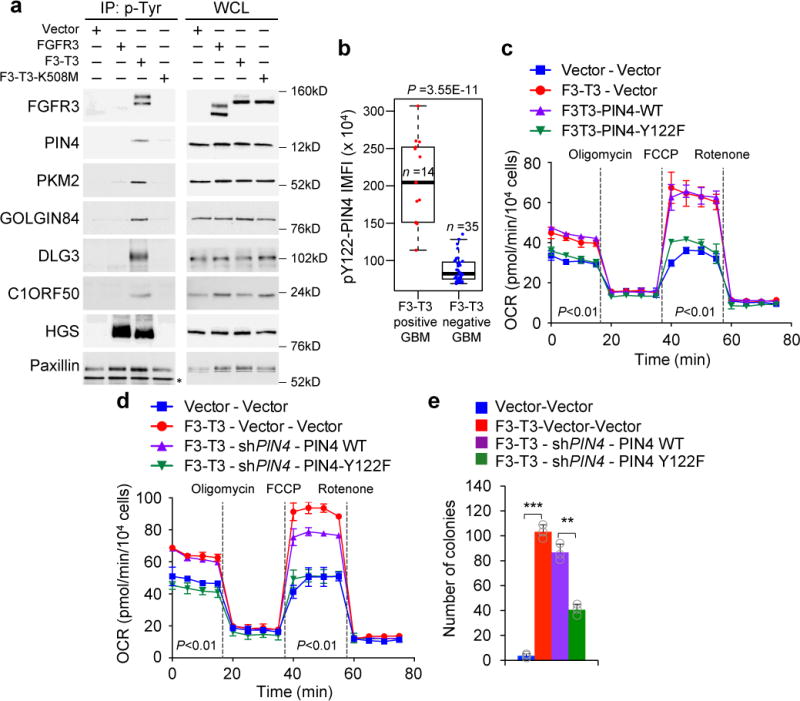
a, Immunoblot of phosphotyrosine immunoprecipitates from SF126 glioma cells (left panels). Right panels, whole cell lysates (WCL). Paxillin is loading control. b, Quantification of pY122-PIN4 integrated mean fluorescence intensity (IMFI) from F3-T3-positive and F3-T3-negative GBM. Box plot spans the first quartile to the third quartile and whiskers show the 1.5× interquartile range. P≤0.0001, two-sided Mann-Whitney test. c, OCR of HA-F3-T3 transduced with PIN4 WT, PIN4-Y122F or vector. d, OCR of HA-F3-T3 following silencing of PIN4 and reconstitution with PIN4-WT or PIN4-Y122F. e, Soft agar colony forming assay of HA treated as in d. Data in c-e are each Mean±s.d. of one representative experiment with n=3 technical replicates. Experiments were repeated three times with similar results. **P≤0.01, ***P≤0.001, two-tailed t-test, unequal variance.