
Figure 3. PGC1α and ESRRG are required for F3-T3-mediated mitochondrial metabolism and tumorigenesis.
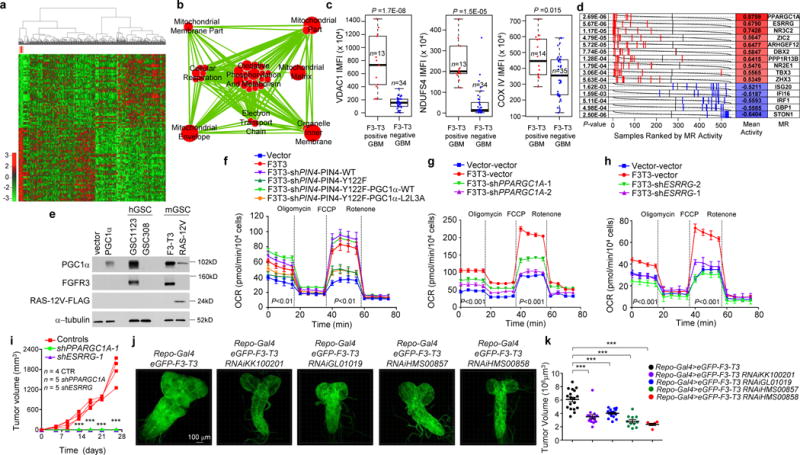
Hierarchical clustering of GBM (n=534) and normal brain (n=10) from the ATLAS-TCGA using DEGs in 9 F3-T3-positive samples (red). b, Enrichment map network of statistically significant GO categories in 9 F3-T3-positive samples (two-sided Mann-Whitney-Wilcoxon test q-value <0.001, NES>0.6). c, Quantification of IMFI of VDAC1, NDUFS4 and COXIV in F3-T3-positive and F3-T3-negative GBM. Box plot spans the first quartile to the third quartile and whiskers show the 1.5× interquartile range. P≤0.0001 (VDAC and NDUFS4); P≤0.05 (COXIV), two-sided Mann-Whitney test. d, MR activity in GBM. Grey curves represent the activity of each MR. Red and blue lines indicate individual GBM (n=534) displaying high or low MR activity, respectively. P-value, two-sided Mann-Whitney test. e, Immunoblot of PGC1α, in human (h) and mouse (m) GSCs. HA transduced with PGC1α or vector are controls. f, OCR of HA-F3-T3 following silencing of PIN4 and reconstitution with PIN4-WT or PIN4-Y122F, in the presence or the absence of PGC1α-WT or PGC1α-L2L3A. g, OCR of HA-F3-T3 transduced with shPPARGC1A. h, OCR of HA-F3-T3 transduced with shESRRG. i, Tumor growth of HA-F3-T3 transduced with vector (n=4), shPPARGC1A-1 (n=5) or shESRRG-1 (n=5). Tumor growth curves of individual mice are shown. j, Representative images of whole brain-ventral nerve cord complex optical projections from Drosophila larvae repo-Gal4>F3-T3 and repo-Gal4>F3-T3;RNAi-srl. k, Quantification of Drosophila larvae repo-Gal4>F3-T3 and repo-Gal4>F3-T3;RNAi-srl tumor volume. Data (Mean±s.d.) are from two (f, n=3 and n=5 technical replicates, respectively) or one (g, h, n=4 technical replicates; k, data are Mean±s.e.m., n=6–17 larvae) experiments. Experiments were repeated two to three times with similar results. **P≤0.01, ***P≤0.001 by two-tailed t-test, unequal variance (f-k).