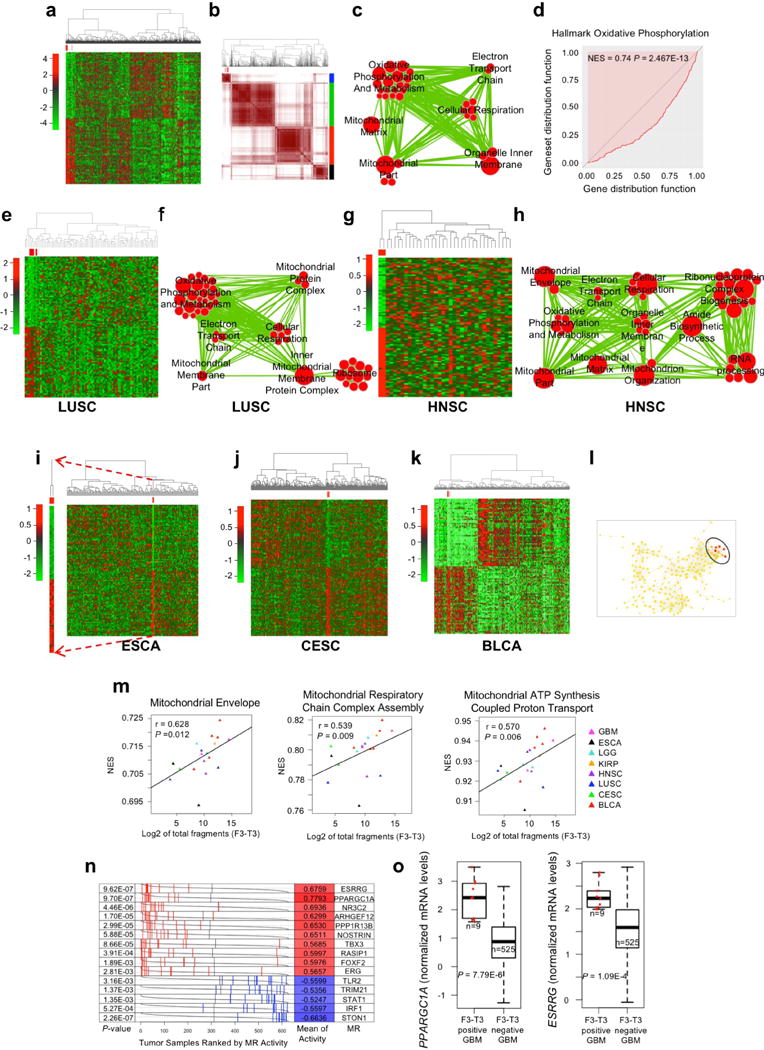
Extended Data Figure 6. Pan-glioma and multi-cancer analysis of F3-T3 fusion-positive samples.

a, Hierarchical and b, consensus clustering for 11 F3-T3-positive (red) out of 627 pan-glioma samples. The 11 F3-T3-positive samples (red) in b fall in one cluster (blue). c, Enrichment map network of statistically significant GO categories (q-value <0.001, NES >0.6, two-sided Mann-Whitney-Wilcoxon test) in the 11 F3-T3 fusion positive pan-glioma samples. Nodes represent GO terms and lines demonstrate their connectivity. Size of nodes is proportional to number of genes in the GO category and thickness of lines indicates the fraction of genes shared between the groups. d, Mann-Whitney-Wilcoxon enrichment plot of the “Hallmark Oxidative Phosphorylation” GO category in F3-T3-positive samples in the pan-glioma cohort. e, Hierarchical clustering for 4 F3-T3-positive (red) out of 86 LUSC samples. f, Enrichment map network of statistically significant GO categories (q-value <0.001, NES >0.6, two-sided Mann-Whitney-Wilcoxon test) in 4 F3-T3-positive LUSC. g, Hierarchical clustering for 2 F3-T3-positive, HPV-positive HNSC (in red) out of 36 samples. h, Enrichment map network of statistically significant GO categories (q-value <0.001, NES >0.6, two-sided Mann-Whitney-Wilcoxon test) in 2 F3-T3-positive HNSC. i, Hierarchical clustering for 2 F3-T3-positive (red) out of 184 ESCA samples. Heatmap of the 2 F3-T3-positive samples is enlarged to the left. j, Hierarchical clustering for 4 F3-T3-positive (red) out of 305 CESC samples. k, Hierarchical clustering for 5 F3-T3-positive (red) out of 408 BLCA samples. l, TDA network of pan-glioma samples (n=627) reconstructed using variance normalized Euclidean distance and locally linear embedding as filter function. The nodes containing F3-T3-positive samples are highlighted in red. m, Correlation between the expression of F3-T3 (Log2 of total fragment, x-axis) and NES (y-axis) of three top ranking mitochondrial functional categories in a multi-cancer cohort including F3-T3-positive samples (n=19) from 8 tumor types (r and P-values are indicated, two-sided Mann-Whitney-Wilcoxon test). n, Analysis of the activity of MRs in the pan-glioma cohort (n=627 glioma). Grey curves represent the activity of each MR with tumor samples ranked according to MR activity. Red and blue lines indicate individual GBM samples displaying high and low MR activity, respectively. P-values, two-sided Mann-Whitney-Wilcoxon test, for differential activity (left column) and mean of the activity of the MR (right column) in F3-T3-positive versus F3-T3-negative samples are indicated. o, Gene expression analysis of PPARGC1A and ESRRG genes in F3-T3-positive and F3-T3-negative GBM; n=9 F3-T3-positive tumors; n=525 F3-T3-negative tumors. Box plot spans the first quartile to the third quartile and whiskers show the 1.5× interquartile range. P-value, two-sided Mann-Whitney-Wilcoxon test. Data in a, e, g, i-k, were obtained using Euclidean distance and Ward linkage method and are based on the top and bottom 50 genes having the highest and lowest probability to be up- or down-regulated, respectively.
