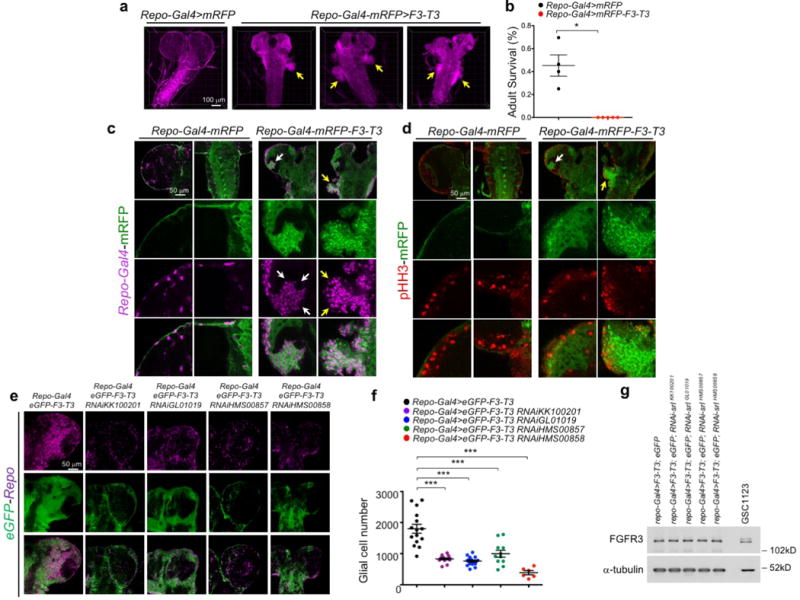
Extended Data Figure 8. Drosophila PGC1α homolog spargel (srl) mediates F3-T3-induced tumor growth.

a, Optical projections of whole brain-ventral nerve cord complexes from Drosophila larvae. Expression of the F3-T3 fusion oncogene using the repo-Gal4 (repo-Gal4>F3-T3) pan-glial driver induced pathological changes in brain and ventral nerve cord with ectopic tissue protrusions (yellow arrows) due to excessive glial cell proliferation and accumulation. b, Survival of larvae bearing F3-T3-driven glial tumors. Larvae bearing F3-T3-driven glial tumors die before developing into adulthood (n=100 biologically independent samples). Data are shown as Mean±s.e.m. P: *<0.05, two-tailed t-test, unequal variance. Individual dots represent the fraction of surviving animals. c, Glial expression of F3-T3 resulted in increased total glial cell number (Repo+; mRFP+ cells) compared to controls. Note the excessive accumulation of glial cells in the brain lobe (white arrows) and ventral nerve cord (yellow arrows). d, Glial expression of F3-T3 increases glial cell proliferation (mRFP+;pHH3+ cells) compared to control. Note the excessive accumulation of glial cells in the brain lobe (white arrows) and ventral nerve cord (yellow arrows). e, Glia-specific srl knockdown in F3-T3-induced glial tumors resulted in decreased total glial number (Repo+; eGFP+ cells) compared to controls. f, Quantification of glia number in control and srl-deficient tumors; (n=15 for repo-Gal4>F3-T3; n = 15 for repo-Gal4>F3-TACC3;RNAiKK100201; n=16 for repo-Gal4>F3-T3;RNAiGL01019; n=11, for repo-Gal4>F3-T3;RNAiHMS00857; n=6 for repo-Gal4>F3-T3;RNAiHMS00858. Data are shown as Mean±s.e.m. P: ***<0.001, two-tailed t-test, unequal variance. g, Western blot analysis of the F3-T3 protein in repo-Gal4>F3-T3 and repo-Gal4>F3-T3;RNAi-srl Drosophila brains. The expression of F3-T3 in human GSC1123 is shown as positive control for F3-T3 and α-tubulin is shown as loading control. Experiments in c–e, g were performed twice.
