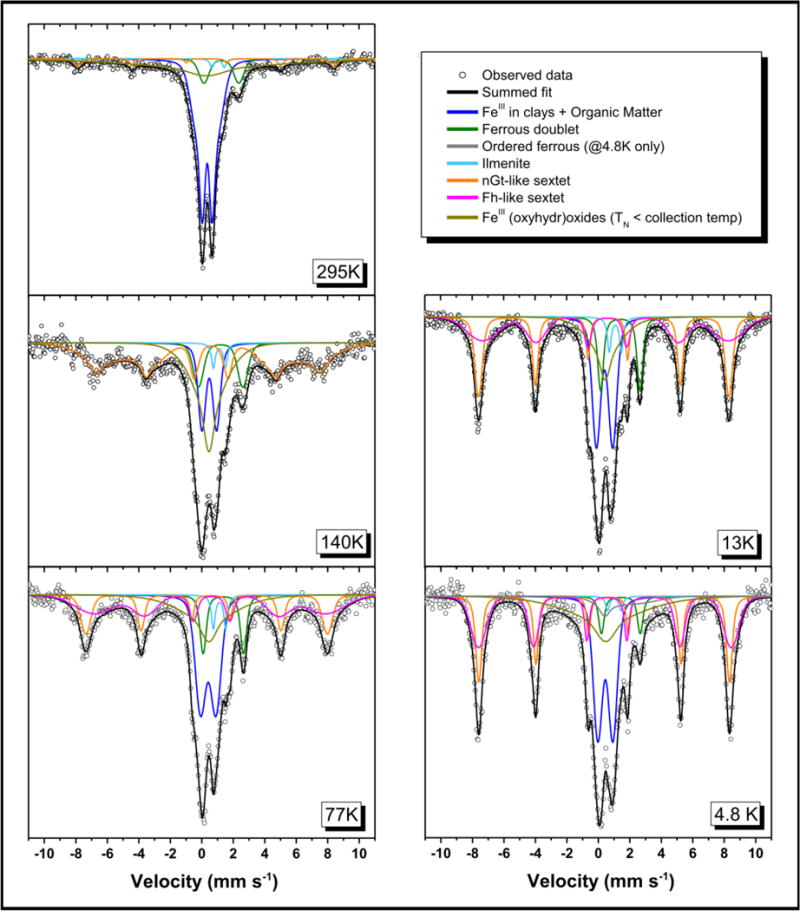
Figure 2.

57Fe Mössbauer spectra of unspiked Bangladesh sediments at 295K, 140K, 77K, 13K and 5K. In each spectrum, the black line is the total calculated fit, through the discrete data points. The resolved spectral components and assignments are: (1) Fe(III) in clay minerals and organic matter (blue line); (2) Fe(II) in sheet silicates or sorbed Fe2+ (dark green line); (3) Fe(II) sorbed to magnetically ordering Fe(III) minerals (gray line); (4) Fe(II) in ilmenite (light blue line); (5) Fe(III) in nano-goethite (orange line); (6) Fe(III) in ferrihydrite (pink line); and (7) Fe(III) in unidentified even more disordered nano-scale oxyhydroxide mineral(s) (umber line).
