


Figure 6.
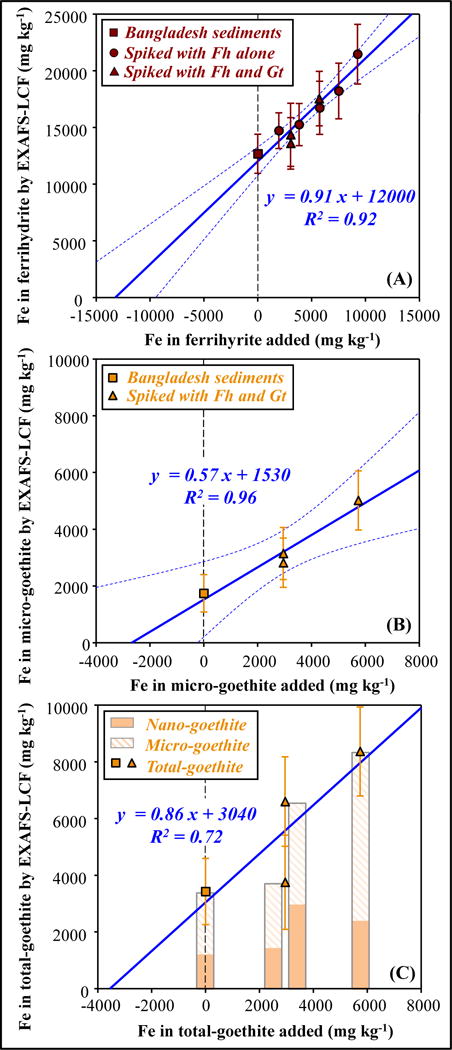
Comparison between added concentrations of (A) ferrihydrite (B)(C) goethite, and the concentrations determined by EXAFS-LCF, for unspiked and spiked Bangladesh sediments. “EXAFS-LCF determined concentration” refers to product of bulk Fe concentration and EXAFS-LCF determined fraction. Solid blue lines represent linear regressions; dashed blue lines, if shown, represent 95% confidence bands. In (C), nano-goethite was included in LCF, the two bars in the middle are offset for clarity.