


Figure 9.
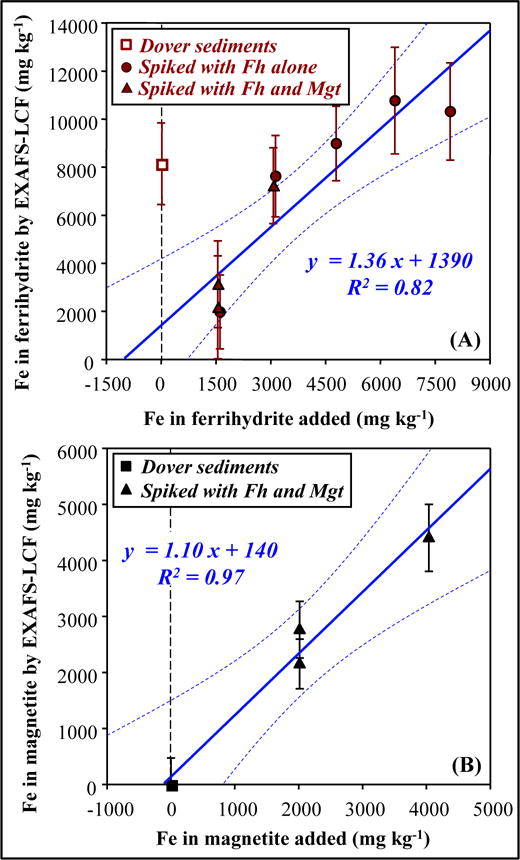
Comparison between added concentrations of (A) ferrihydrite (B) magnetite, and the concentrations determined by EXAFS-LCF, for unspiked and spiked Dover sediments. “EXAFS-LCF determined concentration” refers to product of bulk Fe concentration and EXAFS-LCF determined fraction. In (A), the open square symbol represents the unspiked sample, which was not used in linear regression.