
Figure 2. Distribution of DAPT drawbacks which patients ranked most important to avoid.
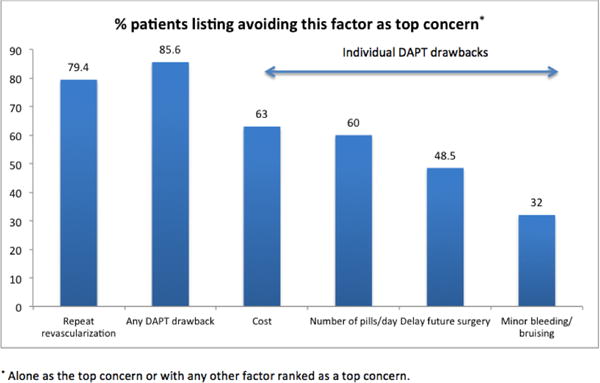
This is a bar graph showing the distribution of patients who listed avoiding different DAPT drawbacks as most important to avoid.
Official websites use .gov
A
.gov website belongs to an official
government organization in the United States.
Secure .gov websites use HTTPS
A lock (
) or https:// means you've safely
connected to the .gov website. Share sensitive
information only on official, secure websites.
This is a bar graph showing the distribution of patients who listed avoiding different DAPT drawbacks as most important to avoid.