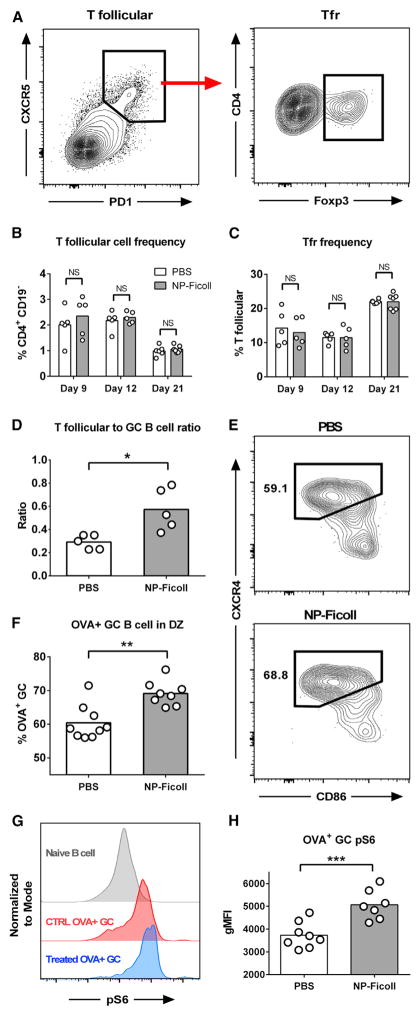
Figure 3. NP-Ficoll Treatment Shifts OVA+ GC B Cell Population to DZ.
Mice were immunized and treated as in Figure 2A.
(A) Gating strategy for total T follicular or Tfr cells (CD4+, CD19−, CXCR5hi, PD1hi and CD4+, CD19−, CXCR5hi, PD1hi, Foxp3−/+).
(B and C) Quantification of T follicular (B) and Tfr cells (C).
(D) Ratio of T follicular to GC B cell after NP-Ficoll treatment on day 9.
(E and F) Representative OVA-specific GC dark zone (DZ) gate (B220+, GL7+, CD4−, CD38lo, OVA+, CxCr4hi, CD86lo) (E) and quantification (F) on day 9.
(G and H) Representative staining intensity of pS6 (G) and quantification (H).
Bars represent mean; NS, not significant; *p < 0.05, **p < 0.01, unpaired Welch’s t test. See also Figure S3.

