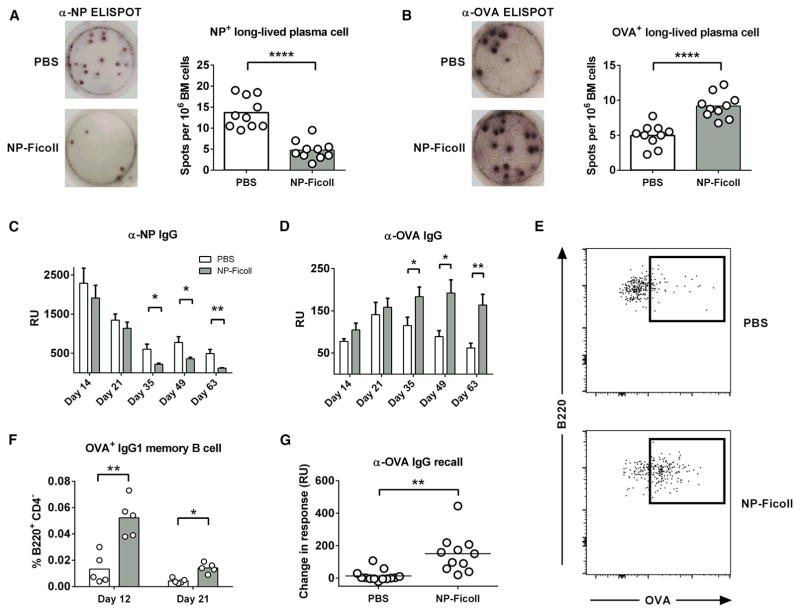
Figure 4. Attenuating GC Competition Increases Subdominant Long-Lived PC, Memory B Cell, and Ab Production.
Mice were immunized and treated as in Figure 2A.
(A and B) NP-specific (A) and OVA-specific (B) ELISPOTs obtained from BM 21 days after primary immunization. Spots are representative of three replicate wells per mice, 10 mice per group.
(C and D) Serum anti-NP (C) and anti-OVA Ab (D) obtained at various time points. Bar represents mean ± SEM, n = 7 or 8 per group.
(E and F) Representative flow plots of IgG1+ OVA-specific memory B cells (B220+, CD4−, CD38+, GL7−, CD138−, IgDlo/−, IgG1+, OVA+) (E) and quantification (F).
(G) α-OVA Ab recall response. Mice were allowed to rest for 21 weeks after immunization and were then challenged with 10 μg of NP-OVA without adjuvant. Data are pooled from two independent experiments representing change in Ab response from 1 day before challenge to 8 days post-challenge for individual mice.
Bars represent mean; *p < 0.05, **p < 0.01, ****p < 0.0001, Welch’s t test. See also Figure S4.

