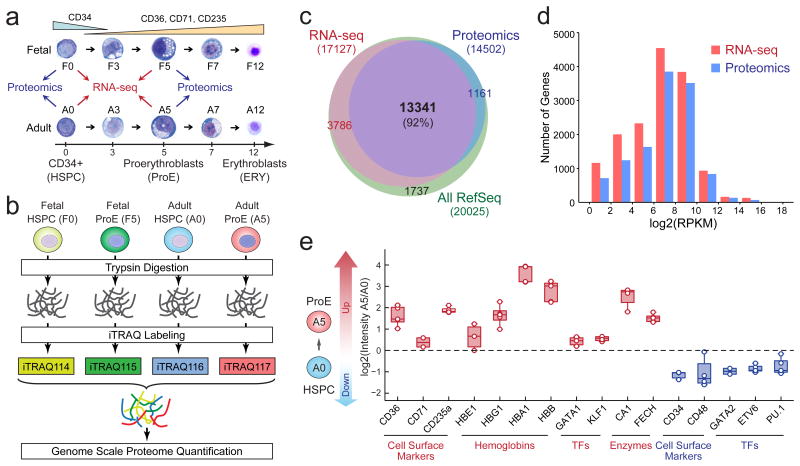
Figure 1. Comparative Proteomic and Transcriptomic Analyses of Human Erythropoiesis.
(a) Fetal and adult-stage CD34+ HSPCs were differentiated into ProEs ex vivo. Cells at matched stages of differentiation were collected for RNA-seq (n = 4 independent experiments) and proteomic (n = 5 independent experiments) analyses. (b) Schematic of iTRAQ-based quantitative proteomic analysis. (c) Venn diagram shows overlap between identified mRNA transcripts and proteins. (d) Overlay of RNA-seq and proteomic data demonstrates that the proteomic analysis achieved a comparable range of quantification as the RNA-seq-based transcriptomic profiling. RPKM, reads per kilobase of transcript per million reads. n = 4 independent RNA-seq experiments and n = 5 independent proteomic experiments. (e) Changes in expression of representative proteins between adult-stage HSPCs (A0) and ProEs (A5) are shown. Each color circle represents the measurement from an independent experiment. Boxes show the mean of the data and quartiles (n = 4 independent RNA-seq experiments and n = 5 independent proteomic experiments). Whiskers show the minimum and maximum of the data.

