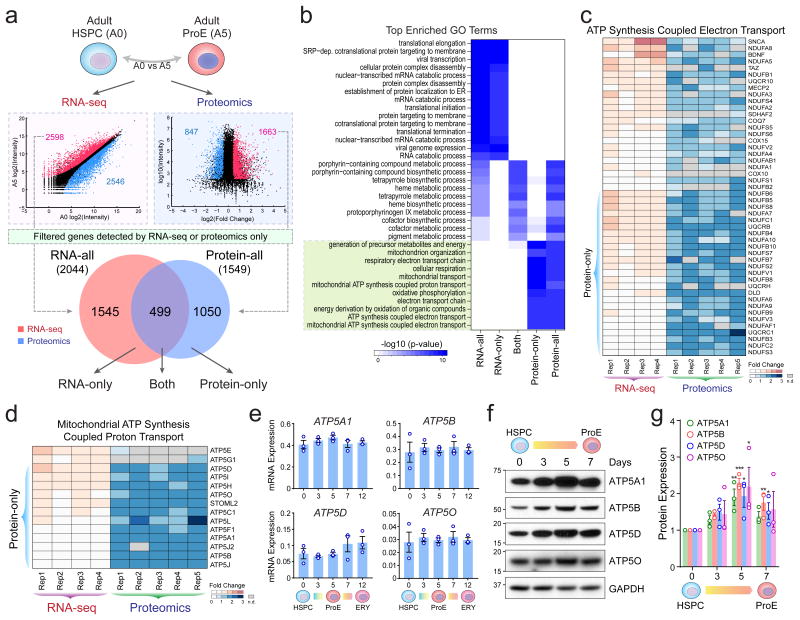
Figure 2. Comparative Transcriptomic and Proteomic Analyses Revealed Post-Transcriptional Control of Mitochondrial Pathways.
(a) The correlation between RNA and protein-level expression changes in adult-stage HSPCs (A0) and ProEs (A5) is shown. Differentially expressed RNA transcripts and proteins (red, upregulated; blue, downregulated) were accessed for overlap. After filtering genes detected exclusively by RNA-seq or proteomics, 2,044 and 1,549 significant upregulated RNAs (RNA-all) and proteins (Protein-all) were identified, respectively. The differentially expressed genes were further divided into three groups based on significant changes at RNA (RNA-only), protein (Protein-only), and both levels, respectively. (b) GO enrichment analysis of protein and RNA expression changes. The green box highlights the top enriched GO terms for Protein-only genes. (c) Expression heatmap is shown for genes associated with ‘ATP synthesis coupled electron transport’. The Protein-only genes are shown on the bottom. n.d. not detected. (d) Expression heatmap is shown for genes associated with ‘Mitochondria ATP synthesis coupled proton transport’. (e) mRNA expression of representative Protein-only genes (ATP5A1, ATP5B, ATP5D and ATP5O) was measured by qRT-PCR in HSPCs and differentiating erythroid cells. Results are mean ± s.e.m. (n = 3 independent experiments). (f) Western blot analysis of representative Protein-only genes. (g) Quantification of Western blot analysis. Results are mean ± s.e.m. (n = 3 independent experiments). Differences relative to HSPCs (day0) were assessed using a repeated-measures one-way ANOVA followed by Dunnett's test for multiple comparisons. *P < 0.05, **P < 0.01, ***P < 0.001 relative to HSPCs (day0) were considered significant. See Statistics Source Data in Supplementary Table 8. Unprocessed original scans of blots are shown in Supplementary Fig. 9.

