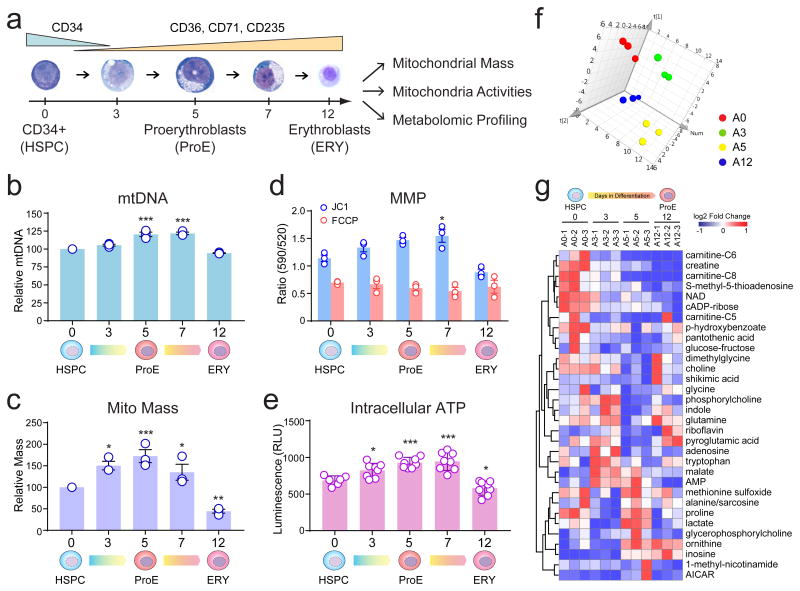
Figure 3. Dynamic Regulation of Mitochondria During Erythroid Differentiation.
(a) Analysis of mitochondrial biogenesis and activities during human erythropoiesis. (b) Mitochondrial DNA (mtDNA) was determined using qPCR-based analysis to measure the ratio of mitochondrial DNA (ND1) versus genomic DNA (18S). The mtDNA content at various stages of erythroid differentiation relative to undifferentiated HSPC (day 0) is shown. (c) Mitochondrial mass was determined by flow cytometry using MitoTracker Green. The mitochondrial mass relative to undifferentiated HSPC (day 0) is shown. (d) Changes in mitochondrial membrane potential (MMP) was monitored by staining with JC1. Cells treated with the protonophore FCCP were analyzed as controls. All data are mean ± s.e.m. (n = 3 independent experiments) (b-d). (e) Changes in intracellular ATP during erythroid differentiation. Results are mean ± s.d. of n = 6 (day0) or n = 8 (day3 to day12) independent measurements pooled from 4 experiments. Differences relative to HSPCs (day0) were assessed using a repeated-measures one-way ANOVA followed by Dunnett's test for multiple comparisons (b-e). *P < 0.05, **P < 0.01, ***P < 0.001 relative to HSPCs were considered significant. (f) Principle component analysis (PCA) of metabolomic profiles in adult HSPCs (A0) and differentiating erythroid cells (A3, A5 and A12). n = 3 biological replicate samples for each group. (g) Heatmap is shown for metabolites with significant changes (see Methods) during erythropoiesis. Unsupervised clustering of metabolites according to the changes in their amounts during differentiation is shown. See Statistics Source Data in Supplementary Table 8.

