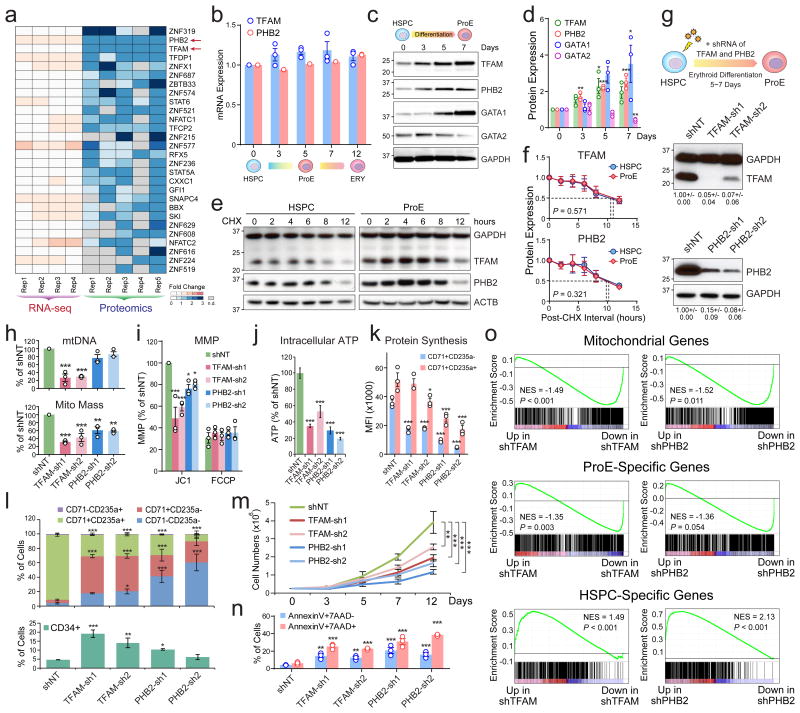
Figure 4. TFAM and PHB2 Are Post-Transcriptionally Regulated and Indispensable for Mitochondria and Erythropoiesis.
(a) Heatmap is shown for transcription factors significantly upregulated at the protein but not mRNA levels. The genes are ranked based on the significance of fold changes in protein expression between HSPCs (A0) and ProEs (A5). n.d. not detected. (b) qRT-PCR analysis of TFAM and PHB2 in HSPCs and differentiating erythroid cells. (c) Western blot of TFAM, PHB2, GATA1 and GATA2 in HSPCs and erythroid cells. (d) Quantification of Western blot analysis. (e) The protein half-lives of TFAM and PHB2 were determined by CHX chase experiments. (f) Quantification of TFAM and PHB2 half-lives in HSPCs and ProEs. The dashed lines indicate the calculated half-lives for both proteins. Results are mean ± s.e.m. of n=3 independent experiments (b,d,f). Differences relative to HSPCs (day0) were assessed using a repeated-measures one-way ANOVA followed by Dunnett's test for multiple comparisons. *P < 0.05, **P < 0.01, ***P < 0.001 (b,d,f). (g) Schematic of lentiviral shRNA-mediated depletion of TFAM or PHB2 in HSPCs, followed by erythroid differentiation (top). Validation of TFAM or PHB2 depletion by Western blot (bottom). Cells transduced with non-targeting shRNA (shNT) were analyzed as controls. The quantified protein expression of TFAM or PHB2 from three independent experiments is shown as mean ± s.e.m. on the bottom. (h) Depletion of TFAM significantly decreased mtDNA (top). TFAM and PHB2 depletion significantly decreased mitochondrial mass (bottom). (i-n) Depletion of TFAM or PHB2 significantly decreased MMP (i), intracellular ATP (j), protein synthesis in CD71+CD235a- and CD71+CD235a+ erythroid progenitors (k), erythroid differentiation measured by the expression of CD34, CD71 and CD235a (l), proliferation (m), and increased apoptosis by AnnexinV and 7-AAD staining (n). Results are mean ± s.e.m. of n=3 independent experiments (h,i,k-n) or mean ± s.d. of n=8 independent measurements from three experiments (j). Differences relative to shNT were assessed using a repeated-measures one-way ANOVA followed by Dunnett's test for multiple comparisons; *P < 0.05, **P < 0.01, ***P < 0.001 (h-n). (o) GSEA analysis of mitochondrial genes, ProE or HSPC-specific genes using the RNA-seq of shTFAM or shPHB2 relative to shNT, respectively. See Statistics Source Data in Supplementary Table 8.

