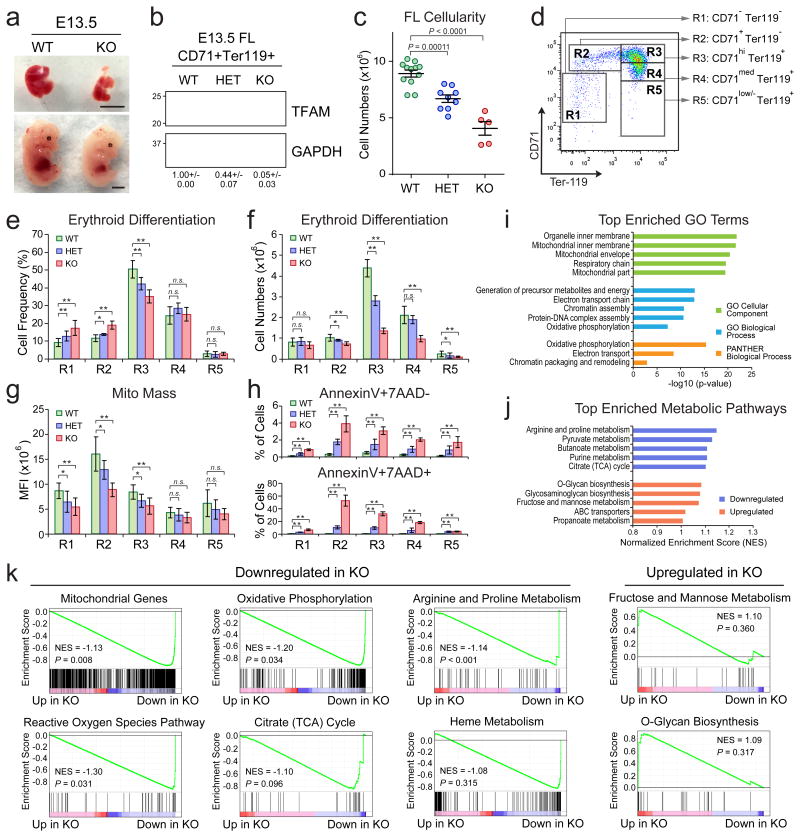
Figure 5. TFAM and PHB2 Are Required for Erythroid Development In Vivo.
(a) Representative pictures of E13.5 Tfam WT and KO embryos (bottom) and fetal livers (top). Scale bar, 0.5cm. (b) Western blot of TFAM expression in WT, HET and KO CD71+Ter119+ E13.5 fetal liver erythroid cells. The quantified protein expression of TFAM is shown on the bottom as mean ± s.e.m of four independent samples for each genotype. (c) Total cell numbers in control (WT; n = 12), Tfam HET (n = 9) and KO (n = 5) E13.5 fetal livers. (d) Erythroid differentiation was assessed by expression of CD71 and Ter119. (e, f) The frequency and number of R1 to R5 cells in Tfam WT (n = 16), HET (n = 6) and KO (n = 4) E13.5 fetal livers. (g) Mitochondrial mass was determined by MitoTracker Green in Tfam WT (n = 16), HET (n = 6) and KO (n = 4) E13.5 erythroid cells. (h) Cell apoptosis in Tfam WT (n = 6), HET (n = 5) and KO (n = 4) E13.5 erythroid cells. Results are mean ± s.d. (c, e-h) and analyzed by one-way ANOVA (c) or a two-tailed t-test (e-h) to evaluate the differences between WT and KO (or HET). *P < 0.05, **P < 0.01 were considered significant. (i) Top enriched gene ontogeny (GO) terms in significantly downregulated genes in Tfam KO erythroid cells. (j) Top enriched metabolic pathways in downregulated or upregulated genes in Tfam KO erythroid cells. (k) GSEA analysis of mitochondrial genes and other indicated signature genes downregulated or upregulated in Tfam KO erythroid cells. See Statistics Source Data in Supplementary Table 8. Unprocessed original scans of blots are shown in Supplementary Fig. 9.

