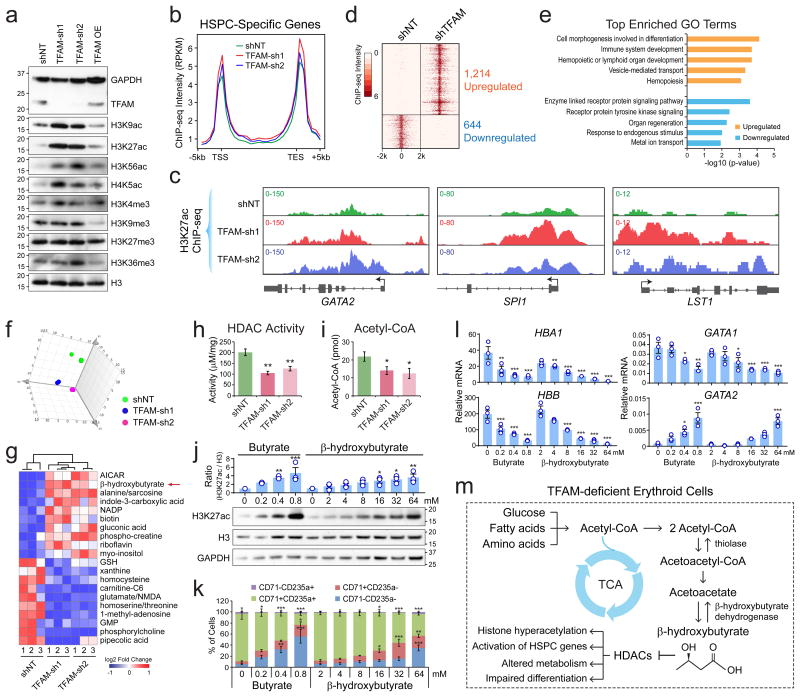
Figure 6. TFAM Depletion Leads to Altered Metabolism and Histone Hyperacetylation in Erythroid Cells.
(a) Western blot of histone modifications in human erythroid (K562) cells transduced with TFAM shRNAs, control (shNT), or overexpression (OE) constructs. Quantification of Western blot is shown in Supplementary Fig. 6a. (b) The distribution of H3K27ac intensity at HSPC-specific genes. The average ChIP-seq intensity (RPKM) is shown between 5kb upstream of transcription start site (TSS) and downstream of transcription end site (TES). (c) H3K27ac ChIP-seq density plots are shown for three representative HSPC-specific genes. (d) Heatmap is shown for differentially enriched H3K27ac ChIP-seq peaks. 1,214 upregulated and 644 downregulated H3K27ac peaks were identified with >4-fold changes in intensity between shTFAM and shNT. (e) Top enriched GO terms in genes associated with the upregulated or downregulated H3K27ac peaks. (f) Principle component analysis (PCA) of metabolomic profiles in K562 erythroid cells transduced with control or TFAM shRNAs. n = 3 biological replicates per group. (g) Heatmap of the top 10 most upregulated or downregulated metabolites between control and TFAM-depleted erythroid cells. (h) HDAC activity in erythroid cells transduced with TFAM or control shRNAs. (i) Acetyl-CoA level in erythroid cells transduced with TFAM or control shRNAs. Results are mean ± s.e.m. of n=7 (h) or n=5 (i) independent measurements. Differences relative to shNT were analyzed by a two-tailed t-test. *P < 0.05, **P < 0.01. (j) Western blot of H3K27ac and H3 in human primary erythroid cells treated with butyrate or β-hydroxybutyrate for 12h. Quantification of Western blot is shown on the top. Results are mean ± s.e.m. of n=3 experiments. (k) Erythroid differentiation was assessed by CD71 and CD235a. Results are mean ± s.e.m. of n=3 experiments. (l) mRNA expression of hemoglobin genes (HBA1 and HBB), GATA1 and GATA2. Results are mean ± s.e.m. of n=3 experiments. Differences relative to control cells (0mM) were assessed using a repeated-measures one-way ANOVA with Dunnett's test for multiple comparisons; *P < 0.05, **P < 0.01, ***P < 0.001 (j-l). (m) Schematic of changes in metabolism and histone acetylation in TFAM-deficient erythroid cells. See Statistics Source Data in Supplementary Table 8. Unprocessed original scans of blots are shown in Supplementary Fig. 9.

