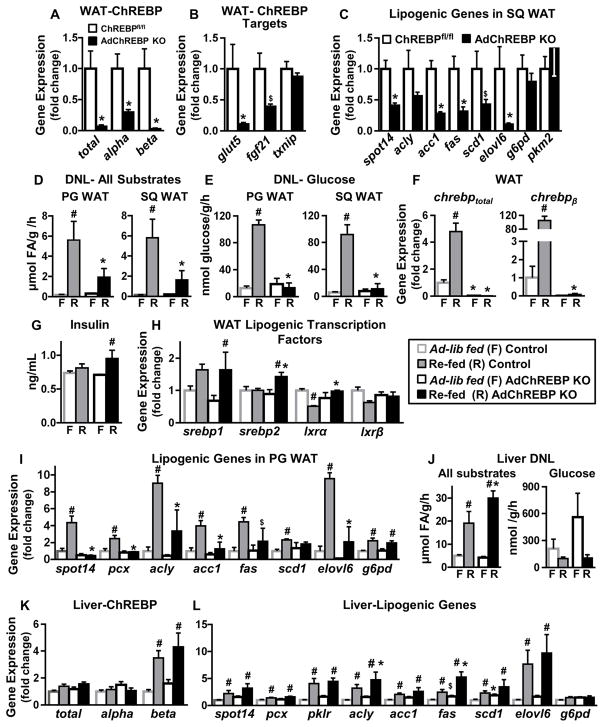
Figure 1. Deletion of ChREBP selectively in adipocytes abrogates sucrose-induced DNL in WAT but not liver.
Expression of total ChREBP and its isoforms (A), ChREBP target genes (B), and lipogenic genes (C) in SQ WAT (n=7–8/group).
DNL from all substrates (D) and glucose (E) in WAT in ad lib-fed (n=7–11/group) and sucrose re-fed (n=3–5/group) mice.
(F) Expression of chrebptotal and chrebpβ in PG WAT.
(G) Serum insulin levels.
Expression of lipogenic transcription factors (H) and lipogenic genes (I) in PG WAT.
n=3–5/group for F–I
(J) DNL from all substrates (left) and glucose (right) in liver in ad lib-fed (n=7–11/group) and sucrose re-fed (n=3–5/group) mice.
Hepatic expression of ChREBP and its isoforms (K) and lipogenic genes (L) (n=3–5/group).
Data are mean±SEM. 16-week old female mice were used for all experiments. mRNA expression was normalized to tbp and shown as fold change over ChREBPfl/fl (A–C) or ad lib-fed controls (F, H–I, K–L). In D–G & J, F= ad lib-fed and R= sucrose re-fed. *p<0.05; $p<0.06 vs. ChREBPfl/fl, same feeding condition; #p<0.05 vs. ad lib-fed, same genotype. (also see Fig S1)

