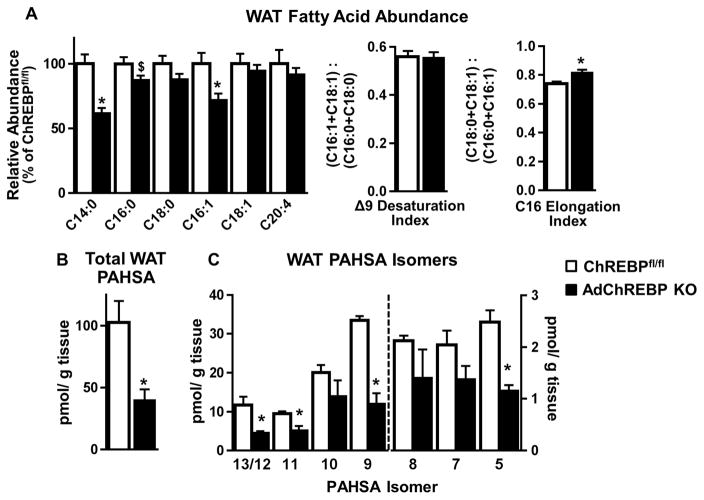
Figure 3. Loss of adipose-ChREBP lowers WAT PAHSA levels.
(A) Relative abundance of fatty acids in SQ WAT (left). Δ9 desaturation index and C16 elongation index (right) (n=7/group).
Levels of total PAHSAs (B) and individual PAHSA isomers (C) in SQ WAT (n=3/group except n=2 for 9-PAHSA levels in ChREBPfl/fl mice).
Data are mean±SEM. 16 week-old chow-fed female ChREBPfl/fl and AdChREBP KO mice were used. *p<0.05 vs. ChREBPfl/fl

