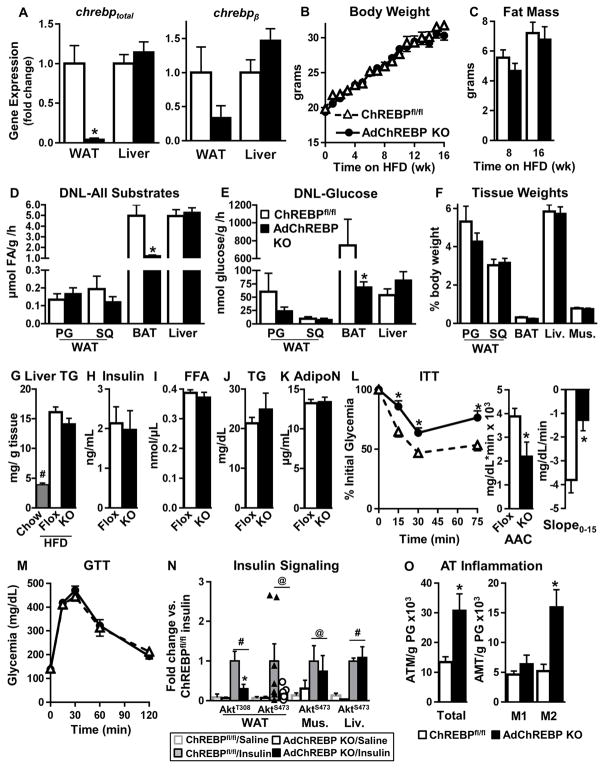
Figure 4. ChREBP deletion in adipocytes results in insulin resistance even in the obese state.
Female mice were used for all experiments. (A) ChREBP expression in SQ WAT and liver of 16 week HFD-fed mice (n=5–6/group).
Body weight (B) and fat mass (C) (n=26–27/group) with HFD.
Ad lib-fed DNL from all substrates (D) and glucose (E) in HFD-fed mice (n=6/group).
(F) Terminal wet tissue weight after 16 weeks of HFD (n=5–6/group).
(G) Liver TG content after 8 weeks of HFD (n=5/group). Chow-fed mice (n=2) were used for comparison. #p<0.05 vs. chow,
Ad lib-fed serum insulin (H), FFA (I), TG (J) and adiponectin (AdipoN) (K) levels after 16 week of HFD.
ITT (0.5U/kg, i.p) (L) and GTT (2g/kg, i.p) (M) after 16 weeks of HFD.
n=13–14/group for H–M
(N) Insulin signaling (1U/kg, 15min) after 20 weeks of HFD. (n=3–7/group). #p< 0.05 (Two-Way ANOVA), @p< 0.05 (t-test) vs. saline.
(O) Numbers of total, and pro-inflammatory (M1) and anti-inflammatory (M2) ATMs in PG WAT measured by flow cytometry after 16–20 weeks of HFD (n=5/group).
Data are mean±SEM. *p<0.05 vs. ChREBPfl/fl, same condition; (also see Fig S4)

