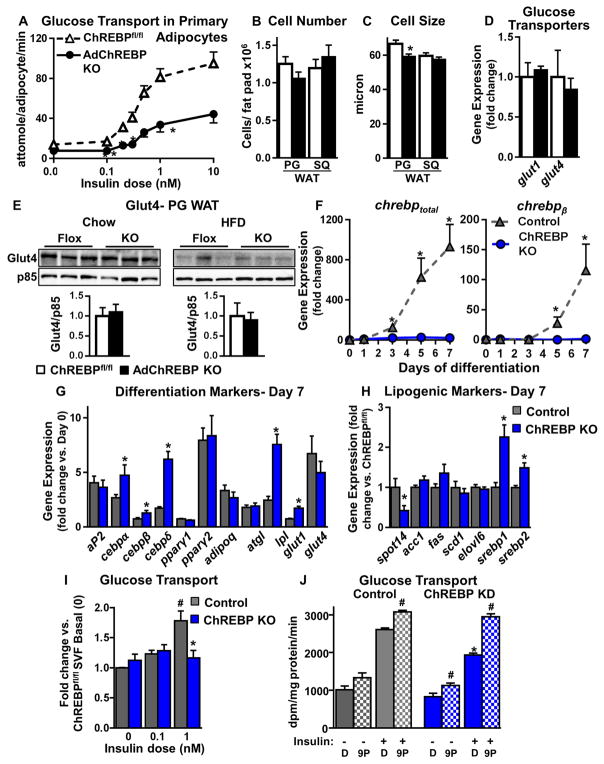
Figure 5. Absence of ChREBP in adipocytes impairs insulin-stimulated glucose transport cell autonomously.
(A) Glucose transport in primary adipocytes isolated from 16 week-old chow-fed female mice (n=7–8/group).
Adipocyte number (B) and size (C) in PG and SQ WAT of female mice (n=17–25/group).
(D) Expression of glucose transporters (Gluts) in SQ WAT of chow-fed mice.
(E) Glut4 protein content in total cellular membranes from PG WAT.
(D–E) Data are fold change over ChREBPfl/fl (n=5–9/group).
(F) Expression of chrebptot (n=6–7/group) (left) and chrebpβ (n=2–6/group) (right) during differentiation of SVF-derived adipocytes. Data are fold change over Day 0 control (ChREBPfl/fl). Expression of differentiation markers (G) and lipogenic genes (H) in Day 7 differentiated SVF-derived adipocytes. Data are fold change over preadipocytes (G) or control (H) (n=8/group).
(I) Insulin-stimulated glucose transport in SVF-derived adipocytes. Data are normalized to protein concentration (n=3 experiments).
(J) Insulin-stimulated glucose transport in 3T3L1 adipocytes with scrambled (control) or ChREBP shRNA (ChREBP KD) after pre-incubation with 9-PAHSA (20μM, overnight). Data are normalized to protein concentration (n=6/group).
Data are mean±SEM. mRNA was normalized to tbp, and protein to p85. *p<0.05 vs. ChREBPfl/fl (A–E) or control (F–J), same condition; #p<0.05 vs. no insulin (I) or no 9-PAHSA (J), same genotype. (also see Fig S5)

