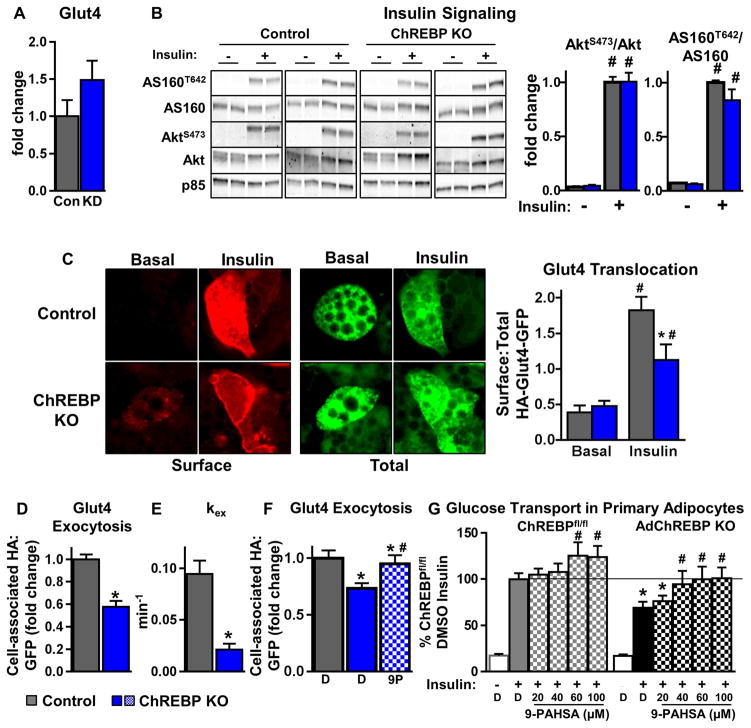
Figure 6. Adipocytes lacking ChREBP have defects in insulin-stimulated Glut4 translocation.
(A) Quantitation of western blot analysis for Glut4 in 3T3L1 adipocytes with scrambled (Con) or ChREBP shRNA (KD). Glut4 levels are normalized to p85 and expressed as fold change over Control (n=5–8/group).
(B) Western blot analysis of insulin (10nM, 10min) signaling in control and ChREBP KO adipocytes (left). The ratio of phosphorylated/total protein is expressed as fold change over control/insulin (n=8–12/group).
(C) Representative images of Glut4 translocation using the HA-Glut4-GFP reporter assay (left). Surface:Total HA-Glut4-GFP was quantified under basal and insulin (1nM)-stimulated conditions (right).
Insulin (1nM)-stimulated Glut4 exocytosis (D), exocytosis rate constant (kex) (E), and effect of 9-PAHSA (9P) (20μM, 2h) on Glut4 exocytosis (F).
Data represented as a fold over control (D, F).
B–F were performed in SVF-derived adipocytes
C–F n=>50 cells from 2–3 combined experiments
(G) Insulin (1nM)-stimulated glucose transport in primary adipocytes isolated from chow-fed female mice. Cells were pre-incubated with DMSO or increasing concentrations of 9-PAHSA for 2.5h prior to insulin (1nM) stimulation (n=8–20/group).
D=DMSO (F–G) Data are mean±SEM. *p<0.05 vs. ChREBPfl/fl(control) same condition (B–E), ChREBPfl/fl DMSO insulin (F–G). #p<0.05 vs. no insulin/basal (B, C), DMSO+insulin (F, G), same genotype. (also see Fig S6)

