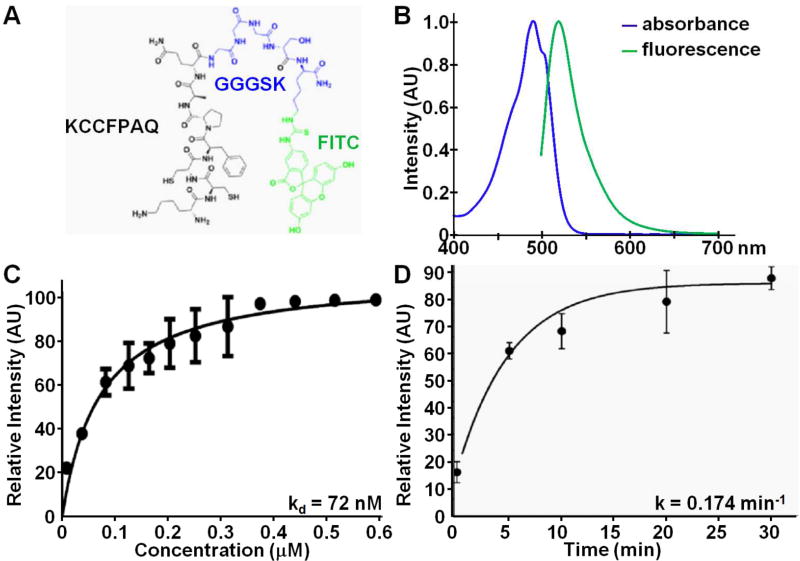
Fig. 1. Fluorescently-labeled peptide.
A) Chemical structure of KCCFPAQ peptide (black) attached via GGGSK linker (blue) to FITC fluorophore (green), hereafter KCC*-FITC. B) Fluorescence spectra of KCC*-FITC show peak absorbance and fluorescence emission at 490 and 519 nm, respectively. We measured C) an apparent dissociation constant of kd = 72 nM, R2 = 0.925, that reflects binding affinity, and D) an apparent association time constant of k = 0.174 min−1, R2 = 0.989, for binding of KCC*-FITC to HT29 cells, resulting in a time scale of 5.76 min. Results are an average of 5 independent experiments for kd and two independent experiments for k.

