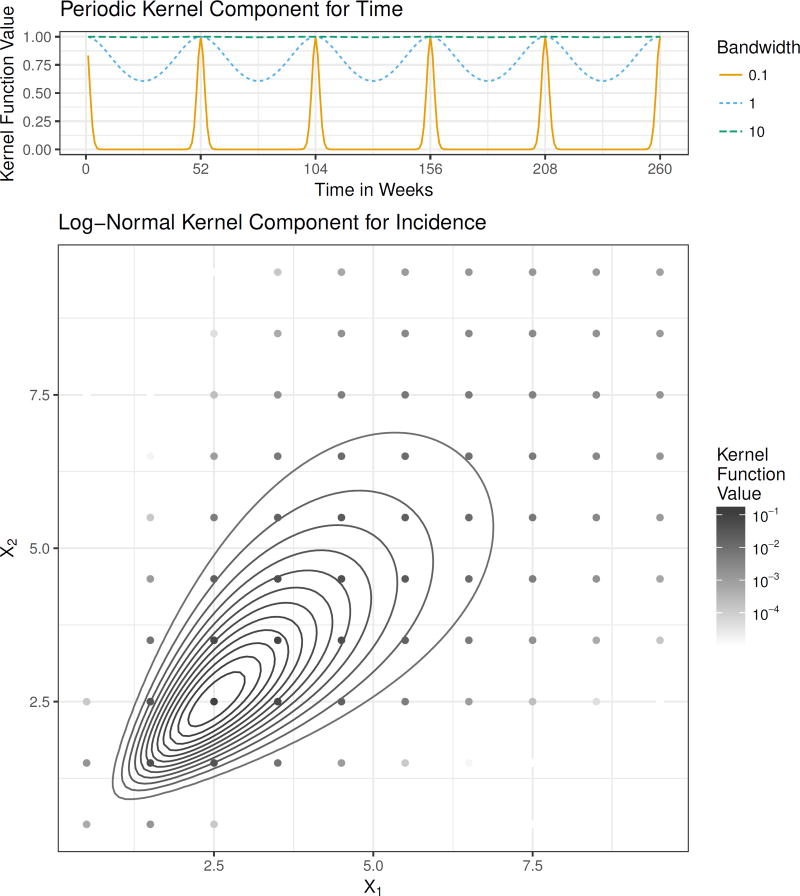
Figure 1.
The components of the kernel function. The top panel shows the periodic kernel function illustrated as a function of time in weeks with ρ = π/52 and three possible values for the bandwidth parameter η. The lower panel shows the log-normal kernel function in the bivariate case. The curves indicate contours of the continuous kernel function and the points indicate the discrete kernel function, which is obtained by integrating the continuous kernel function. The kernel is centered at (2.5, 2.5) and has bandwidth matrix .

