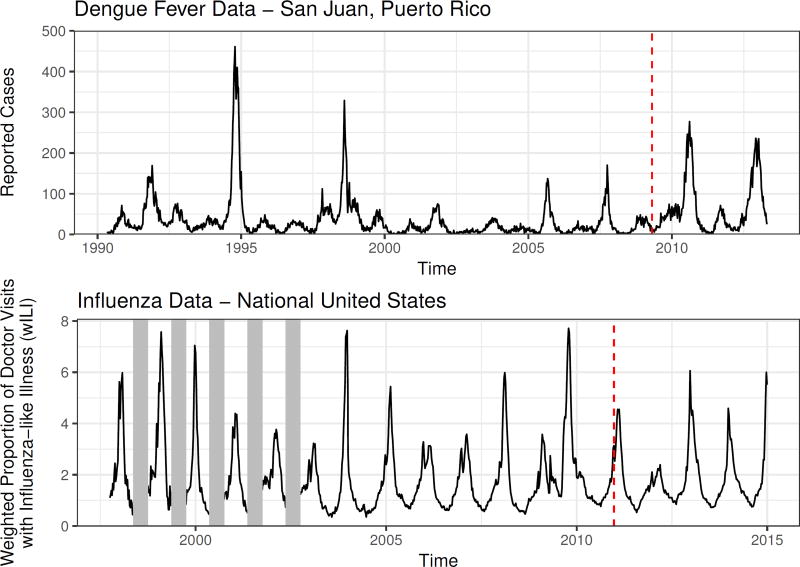
Figure 3.
Plots of the data sets we apply our methods to. In each case, the last four years of data are held out as a test data set; this cutoff is indicated with a vertical dashed line. For the flu data set, low-season incidence was not recorded in early years of data collection. These missing data are indicated with vertical grey bars.

