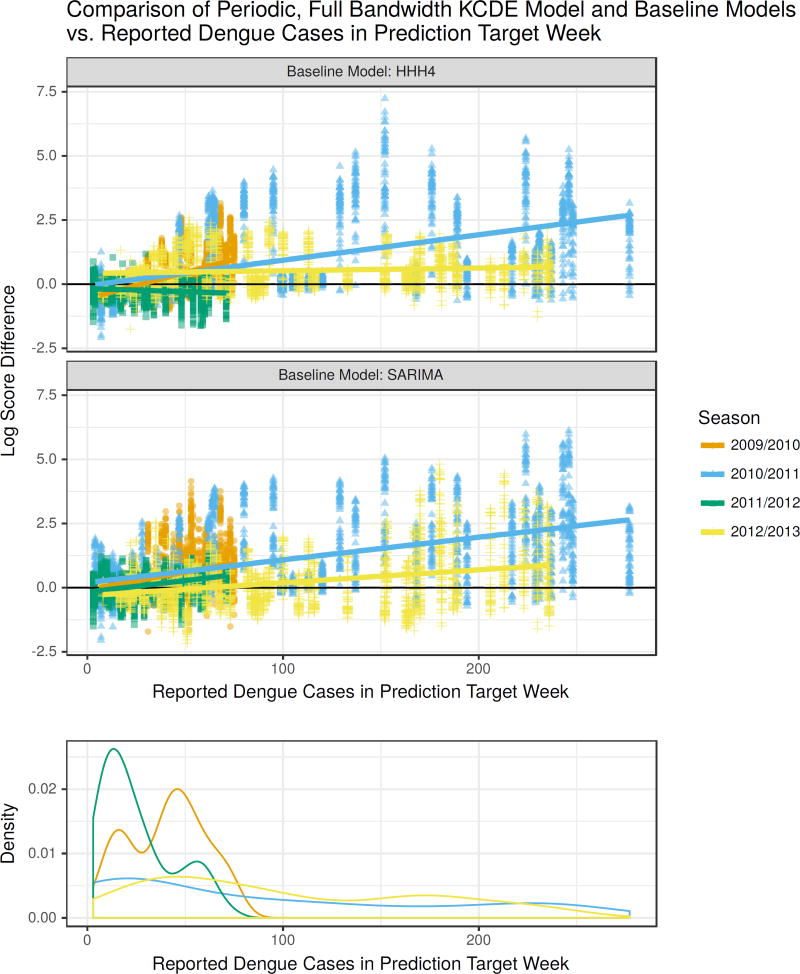
Figure 4.
Differences in log scores for the weekly predictive distributions obtained from the Periodic, Full Bandwidth KCDE model and the baseline models, plotted against the observed incidence in the week being predicted. For reference, a log score difference of 2.3 (4.6) indicates that the predictive density from KCDE was about 10 (100) times as large as the predictive density from the baseline model at the realized outcome. Each point corresponds to a unique combination of prediction target week and prediction horizon. The lower panel displays a density estimate of incidence levels in each week of the season separately for each season in the test phase.

