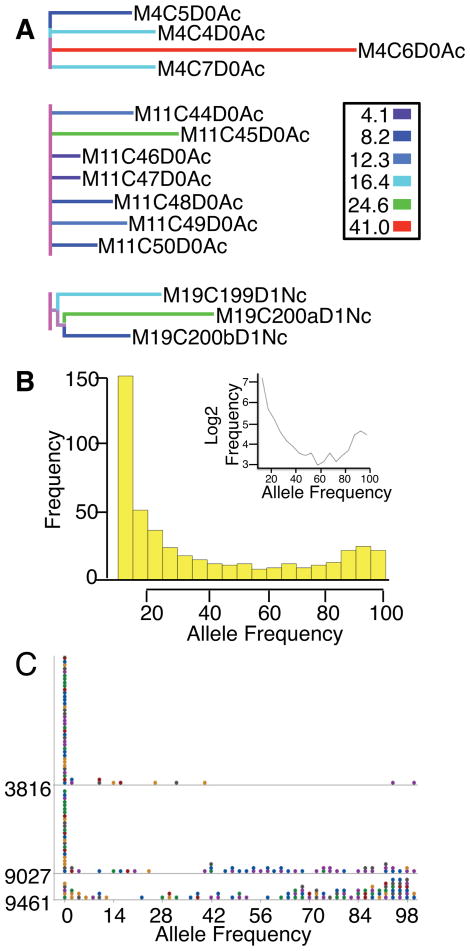
Figure 2. Allele frequencies inherited from the mother between mouse single mitochondrion samples at high confidence positions.
See also Fig. S1, Fig. S2, and Fig. S3. (A) Sample lineage tree for single mitochondrion samples of pups from mother IDs 4,11, and 19 scaled to the number of SNVs per sample indicated by the key to the right. (B) Histogram of read frequencies (10%–100%) of the most abundant non-reference alleles across all single mitochondrion (n=118). The inset plots the log2 transformed frequencies against the minor allele frequencies. (C) Dot plot of the most frequent non-reference allele frequency for all 118 single mouse mitochondrion for position 3816, 9027, or 9461. Each dot represents up to 4 observations, each of which is color coded based on the mother ID.

