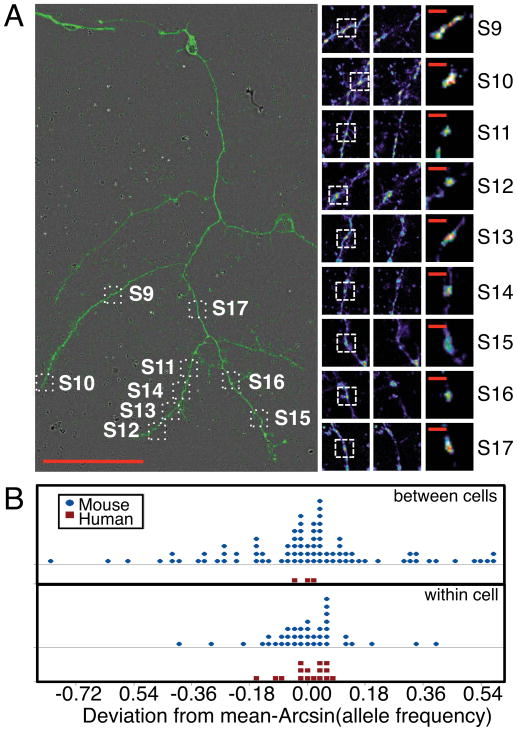
Figure 3. Relationship between human single mitochondrion and comparison to mouse. See also Fig. S3.
(A) Image of human cell number 5. Scale bar = 100 microns. Pre- and post- isolation images and enlarged mitochondrion images shown adjacent. Scale bar = 10 microns. (B) Dot plot of arcsin transformed allele frequency deviations from means for human or mouse single mitochondrion. The top two panels show between cell deviations (human: n= 3 cells from 1 individual; mouse: n=19 individuals each with 3,2,2,9,6,3,7,3,3,3,2,4,7,2,12,8,3,4, or 2 cells), while the bottom panel shows within cell deviations (human: n=3 cells each with 2,5, or 9 mitochondrion (DF = 13), mouse: n=16 cells with 2,2,5,2,2,3,2,2,3,2,3,2,3,2,3, or 2 mitochondrion (DF = 24).

