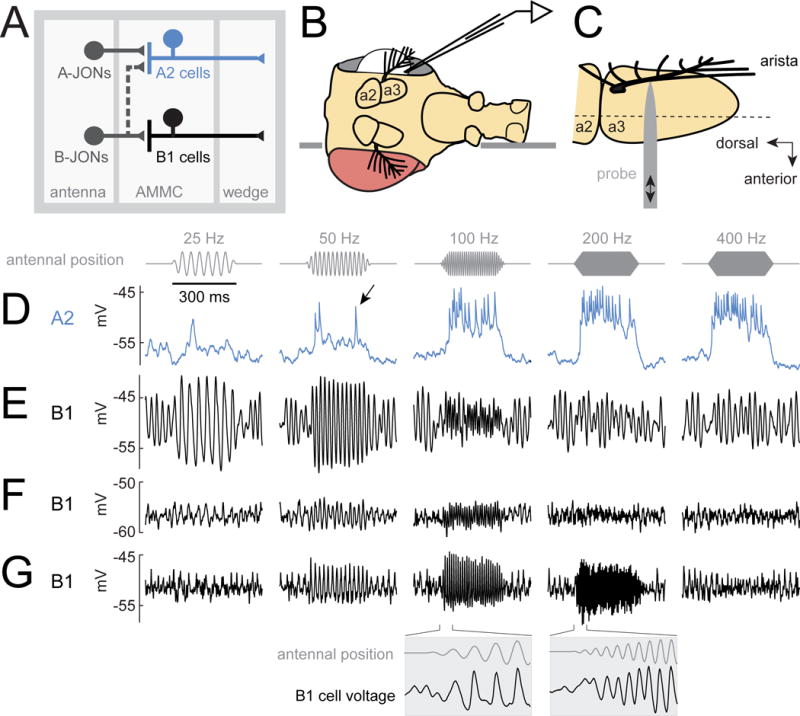
Figure 1. AC/DC responses to mechanical vibrations.

(A) A2 cells receive most of their input from A-type JONs, while B1 cells receive input from B-type JONs. Both A2 and B1 cells project to the wedge, a higher-order processing center for mechanosensory signals.
(B) The fly is inserted into an aperture in a thin platform (horizontal line). The head is rotated 90° relative to the body. One eye is removed, allowing access to the lateral brain. In vivo patch-clamp recordings are performed from the somata of GFP labeled A2 cells and B1 cells in the brain. The dorsal side of the platform is bathed in saline, and the ventral side remains dry.
(C) Antenna viewed from above the prep (i.e., with the lateral side of the antenna facing the viewer, so that the arista points out of the page). A piezoelectric probe is attached to the arista. Linear probe movement causes rotation of the most distal antennal segment (a3). The dashed line indicates the approximate axis of a3 rotation. JONs are housed within the next-most-proximal segment (a2), which does not rotate. JONs encode rotations of a3 relative to a2.
(D) Stimulus-evoked voltage responses in an example A2 cell. Stimuli are sinusoidal oscillations about the resting position of the antenna. The stimulus amplitude is 0.45 μm (mean-to-peak amplitude of the probe’s movement). The antenna’s resting position is zero, and movement toward the head is positive, while movement away from the head is negative. In A2 cells, antennal vibrations elicit depolarizing responses and spikes (arrow, see also Figure S1). Spikes recorded at the soma are small, which is typical of many Drosophila neurons.
(E–G) Same for three example B1 cells. In B1 cells, vibrations elicit sinusoidal modulations of the membrane potential which are phase-locked to the stimulus. Insets below are plotted on a 10× expanded time base. Oscillations prior to stimulus onset are likely due to normal “spontaneous” oscillations in the tension on JONs (Figure S2). See Methods for genotypes used in each figure.
