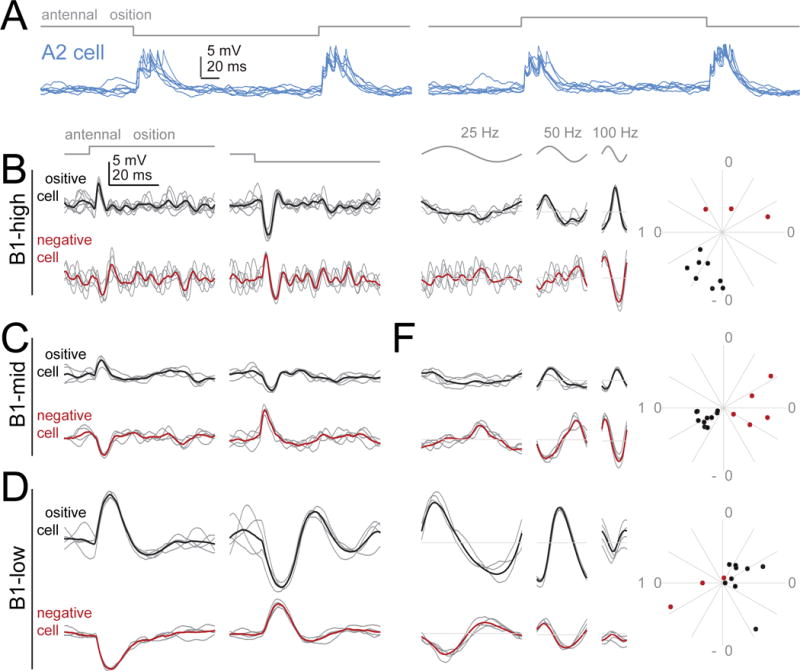
Figure 3. Direction-sensitivity and opponency.

(A) Responses in an example A2 cell to step displacements of the antenna (3 μm away from its resting position). Positive steps push the antenna toward the head; negative steps pull it away. Like all A2 cells, this cell depolarizes transiently in response to both step onset and step offset, for a step in either direction. Responses to 7 stimulus repetitions are overlaid. Voltage scale is the same for all traces in this figure, but note different time scale in (A) versus (B-G).
(B) Responses of two example B1-high cells to step displacements (3 μm). One is depolarized by the positive step, whereas the other is depolarized by the negative step. In both cases, the response begins with a delay of ~2.5 ms from stimulus onset. Gray traces are example trials, black/red traces are the mean of all trials.
(C) Same but for two B1-mid cells.
(D) Same but for two B1-low cells.
(E-G) Responses in the same 6 cells to sinusoidal stimuli (stimulus amplitude is 1.5 μm). The responses of each opponent pair are anticorrelated; this is most obvious at the preferred frequency of each cell type. Radial plots show the phase of the Fourier component at the stimulus frequency (100 Hz for B1-high/-mid, 25 Hz for B1-low). Positive cells (black) were generally about half a cycle out of phase with negative cells (red). For low frequency vibrations, positive cells led the stimulus. As the stimulus frequency increased, the phase lead for positive cells turned into a phase lag. Data are from 11 B1-high cells, 15 B1-mid cells, and 12 B1-low cells.
