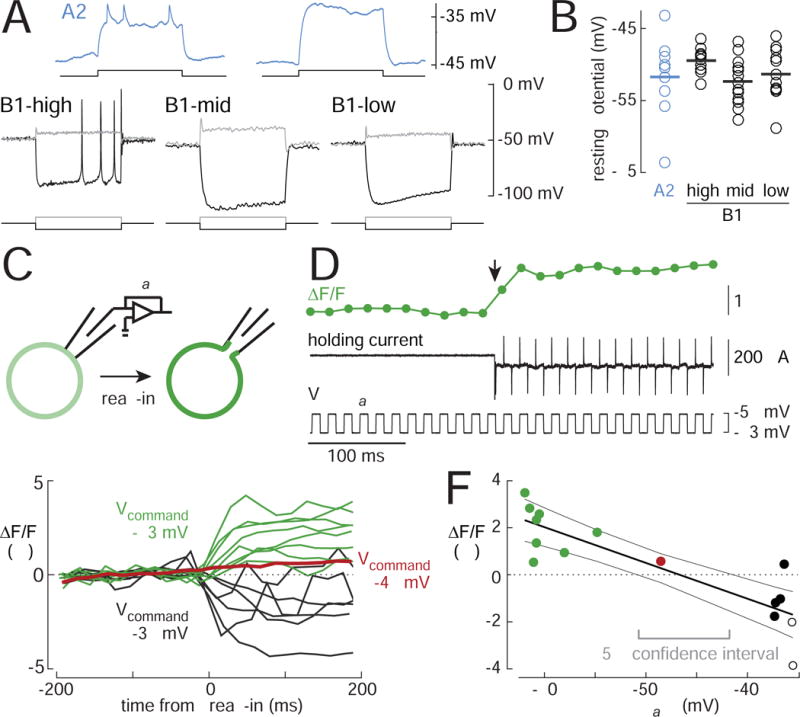
Figure 6. B1 cells rest in depolarization block.

(A) Voltage responses to current injection via the recording electrode. Depolarizing the A2 cell elicits a train of small spikes; these spikes are blocked by TTX (1 μM). By contrast, B1 cells fire only a single small spike at the onset of depolarization. Surprisingly, when B1-high cells are hyperpolarized far below their resting potential, they can fire large spikes. Current steps are 100 ms for A2 cells and 500 ms for B1 cells).
Injected current in these examples was (in pA) +20 (A2), +40/−80 (B1-high), +40/−30 (B1-mid and B1-low).
(B) Resting membrane potential in A2 and B1 cells (n=9, 11, 15, 12 cells). Horizontal lines are means.
(C) Optical measurement of membrane potential. A cell-attached recording is established in voltage-clamp mode, and ArcLight fluorescence in the cell body is imaged before and after “break-in”. ArcLight fluorescence goes up with hyperpolarization and down with depolarization. The change in fluorescence upon break-in should indicate the difference between Vcommand and Vrest.
(D) A typical experiment. Vcommand is stepped rapidly between −63 mV and −58 mV while negative pressure is applied to the patch. Break-in is signaled by the sudden appearance of large current transients. Break-in increases ArcLight fluorescence (arrow).
(E) Overlay of ΔF/F versus time for all experiments. Vcommand was either −63 mV (green), −48 mV (red), or −38 mV (black). Each line represents a different cell (n=15).
(F) ΔF/F (averaged over ~200 ms after break-in) versus Vcommand. Filled circles are B1 cells, empty circles are A2 cells. Black lines indicate linear regression ± 95% confidence intervals (ΔF/F = m· Vcommand +b, m = −0.15% / mV, b = −7.11%). Gray bracket indicates the range of Vrest values within the 95% confidence interval.
