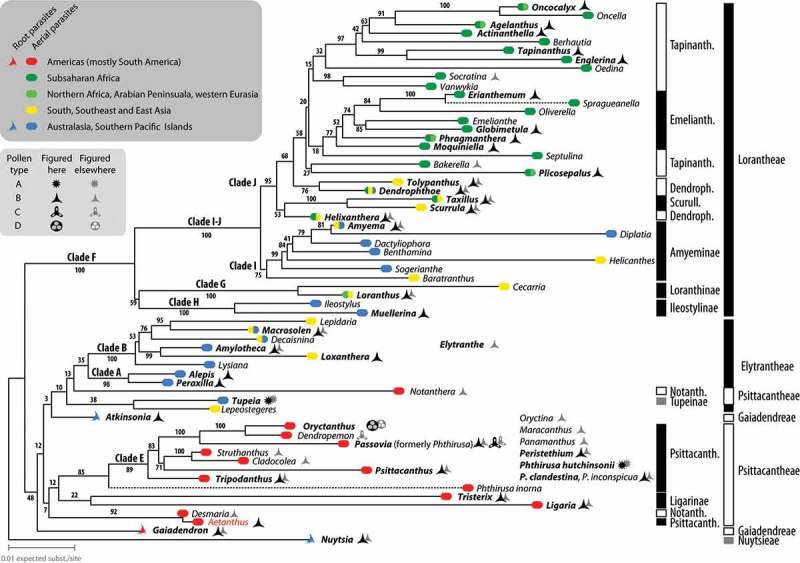
Figure 2.

Molecular phylogram and phylogeographic-systematic framework for the Loranthaceae. Shown is the ‘best-known’ maximum likelihood tree based on a concatenated genus-consensus sequence matrix including data from two nuclear-encoded ribosomal DNA regions (18S, 25S rDNA) and three plastid regions (matK gene, trnL intron and trnL-trnF intergenic spacer, and rbcL gene) rooted with Nuytsia as the first diverging lineage (following Vidal-Russell & Nickrent 2008b; Su et al. 2015). Stippled lines indicate branches that have been reduced by factor 2. Number at branches indicate non-parametric bootstrap (BS) support based on 1000 BS replicates. Genera palynologically studied by us in bold font. Clades labelled according to Vidal-Russell and Nickrent (2008b); systematic framework follows Nickrent et al. (2010; black bars: potential monophyletic groups; white bars: putative paraphyletic or polyphyletic groups; grey bars: monotypic groups). Red font, misplaced Aetanthus (missing data artefact).
