
Figure 3.
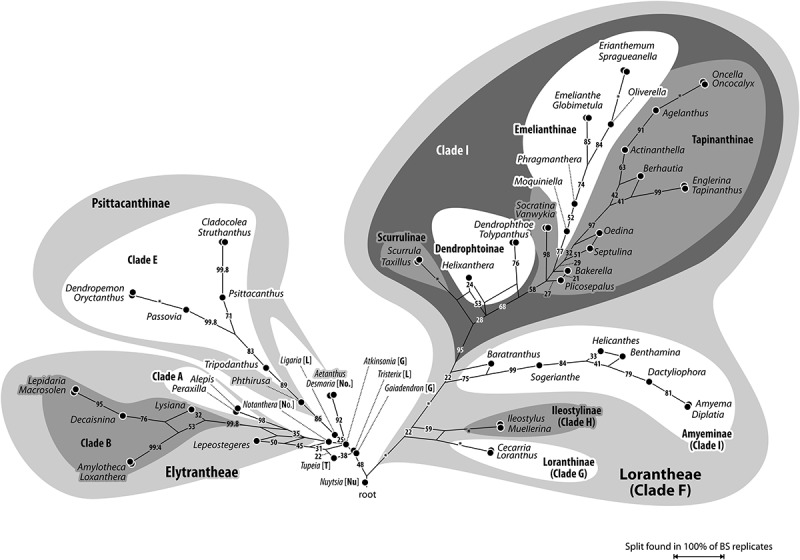
Bipartition (bootstrap support) network inferred from the maximum likelihood (ML) bootstrap (BS) sample. Edge-lengths in the graph are proportional to the frequency of the according taxon bipartition in the ML-BS replicate sample. This frequency translates into BS support when mapped on a given tree/branch; BS support values are given for each corresponding edge. Box-like structures show support of alternative, competing, partly incompatible splits, which limit BS support of putative clades in any hypothetical or optimised topology (Figure 2); hence, can provide a more comprehensive overview about the signal in the used data set. Molecular clades as found by Vidal-Russell and Nickrent (2008b) and systematic groups as defined by Nickrent et al. (2010) are annotated. Abbreviations: [G], Gaiadendreae; [Nu], Nuytsieae; Psittacantheae (not annotated in figure): [L], Ligarinae; [No], Notantherinae; Psittacanthinae (not abbreviated); [T], Tupeinae.