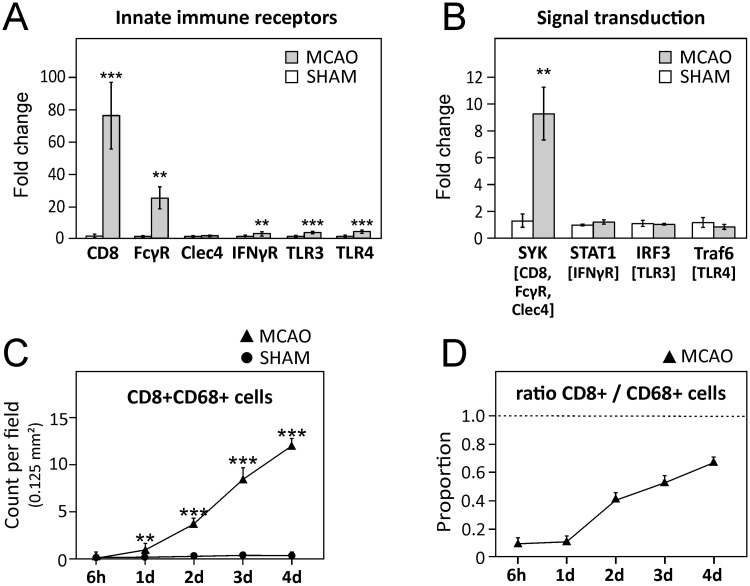
Fig 3. CD8 signaling in post-stroke brain.
(A) Expression of innate immune receptors and of (B) signal transduction molecules of respective pathways (indicated in brackets) involved in M1 polarization analyzed 4 days after stroke in the perilesional areas of the ischemic hemisphere. (C) Quantification of CD8+CD68+ cells as average (Av) counts ± SEM per field of 0.125 mm2 (D) Proportion of CD68+ cells expressing CD8 for MCAO animals. Sham animals are not plotted that lacked either or both CD8+ or CD68+ cells showed ratio was either 0 or a/0. A-D: Data are presented as mean ± SEM. * P < 0.05; ** P < 0.01; *** P < 0.001.

