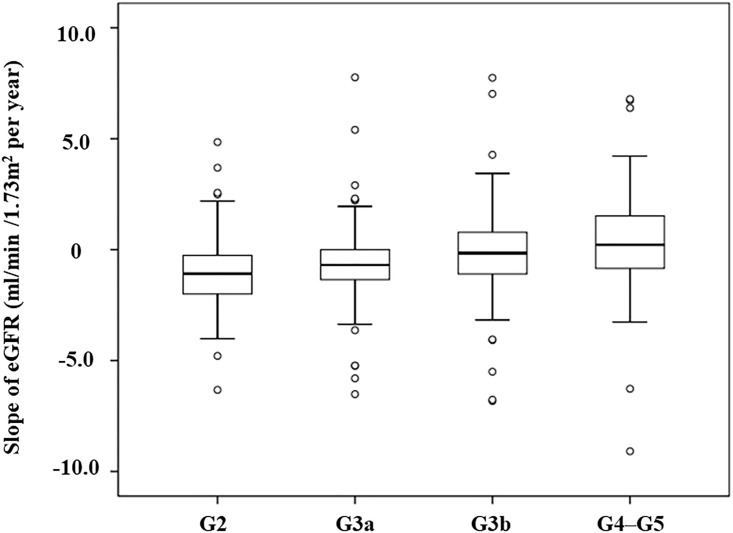
Fig 2. Slope of estimated glomerular filtration rate (eGFR) in patients with normal-range proteinuria from enrollment to the last visit (n = 352).
Box and whisker plot (box represents the interquartile range; whiskers extend to the most extreme data point, which is no more than 1.5 times the interquartile range from the box; circles beyond the whiskers are extreme values; and the line within the box represents the median) represent changes in eGFR from baseline to the last visit.

