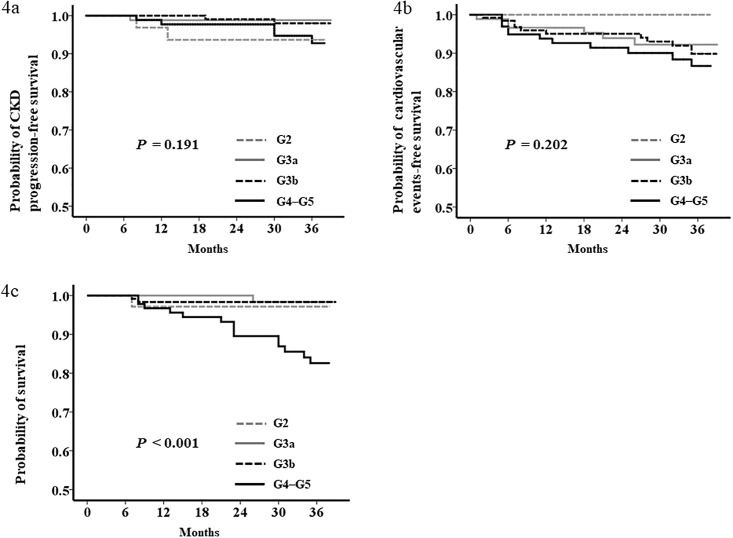
Fig 4. Kaplan–Meier curves for event-free survival in patients with normal-range proteinuria according to chronic kidney disease (CKD) stage (n = 352).
Kaplan–Meier analysis demonstrated that chronic kidney disease (CKD) progression (Fig 4a) and development of cardiovascular events (Fig 4b) were not significantly different among CKD stages. All-cause death was significantly higher in stage G4–G5 CKD (Fig 4c).

