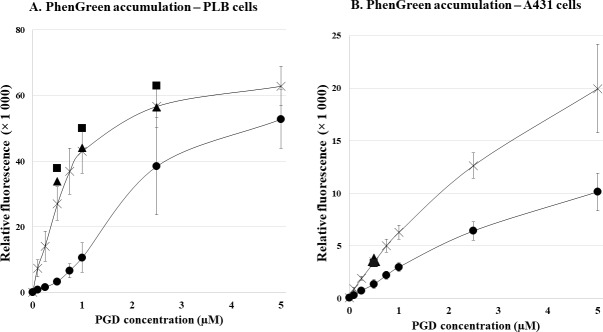
Fig 1. Fluorescent PG accumulation in human cells, effect of ABCG2 expression—Flow cytometry studies.
Panel A. PGD-concentration dependent PG accumulation in control PLB cells (×) and in PLB-ABCG2 cells (●). The black squares (■: ABCG2) and triangles (▲: CTRL) demonstrate PG accumulation in the presence of 2.5μM KO143, a specific ABCG2 inhibitor. Panel B. PGD-concentration dependent PG accumulation in control A431 (×) and A431-ABCG2 (●) cells, measured in EDTA-DPBS medium for 30 minutes at 37°C. The black squares (■: ABCG2) and triangles (▲: CTRL) demonstrate PG accumulation in the presence of 2.5μM KO143 at 0.5μM PGD. ± SD values are indicated.

