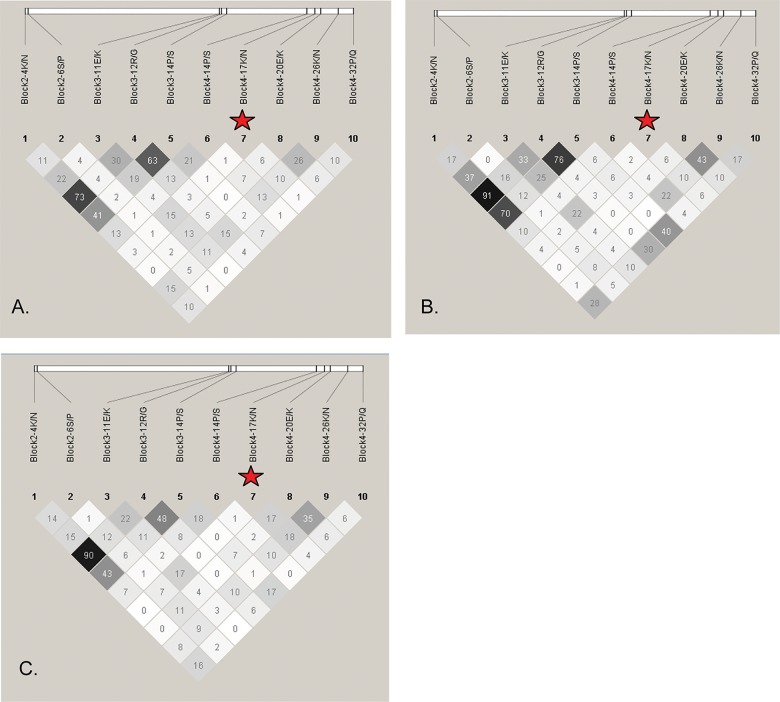
Fig 4. Linkage disequilibrium (LD) structures of 3D7-liked msp2 of P. falciparum in Thailand.
Pairwise LD plots based on r2 between the 10 bi-allelic polymorphisms with minor allele frequency ≥ 10% were calculated for P. falciparum from mild (A), severe (B), and cerebral malaria patients (C). White, shades of grey, and black squares indicate no LD (r2 = 0), intermediate LD (0 < r2 < 1), and strong LD (r2 = 1), respectively. LD structures were plotted using haploview software and amino acid changes are shown. The polymorphisms associated with cerebral malaria are labeled with a red star.

