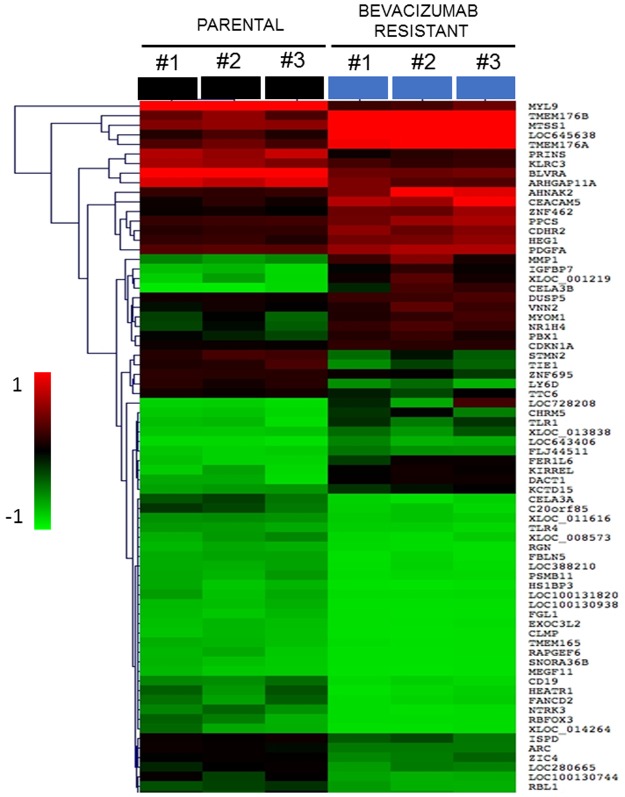
Fig 1. Heat map showing up-regulated and down-regulated differentially expressed genes (DEGs) in bevacizumab-resistant colon cancer tumors.
A bidirectional hierarchical clustering heat map was constructed using MultiExperimental Viewer(MeV). The expression values are log2 fold changes (>1 or <−1, FDR <0.05)) between corresponding bevacizumab -resistant HT29 xenograft tumors and non-treated HT29 xenograft tumors. Black represents no change in expression, green represents down-regulation, and red represents up-regulation.

