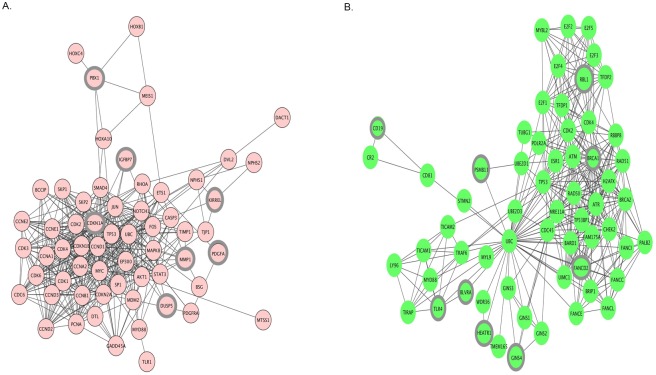
Fig 2. Protein–protein interaction (PPI) network of differentially expressed genes(A) up-regulated genes and (B) down-regulated genes.
The PPI pairs were imported into Cytoscape software as described in methods and materials. Pink nodes represent up-regulated genes while green nodes represent down-regulated genes. The lines represent interaction relationship between nodes. The highlighted DEGs represents degree = >2.

