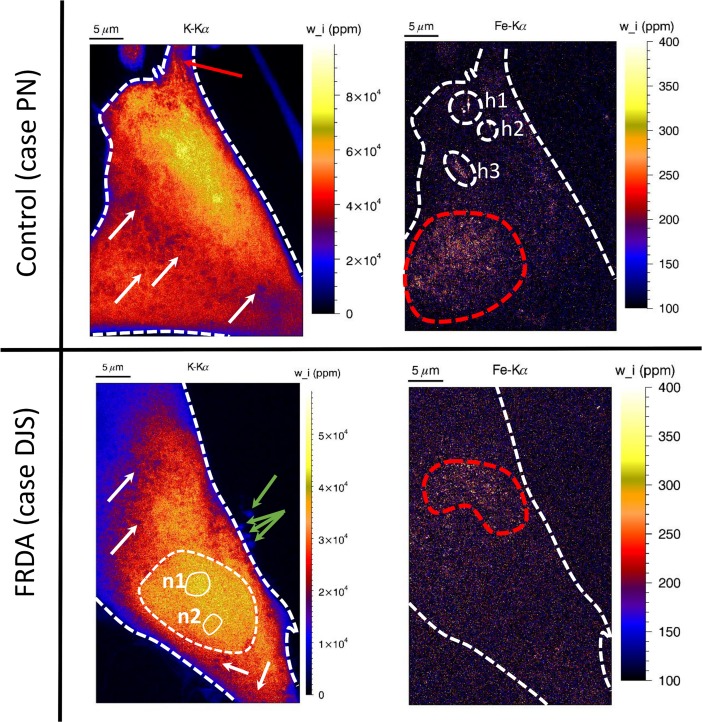
Fig 2. Potassium and iron elemental distribution within control fibroblast case ‘PN’ (upper row) and FRDA fibroblast case ‘DJS’ (lower row).
Scale bar indicates the background-corrected mass fraction in ppm, calculated from a mean cell thickness of 10 μm. Pixel size in the images is 55 nm; acquisition time for each pixel is 50 ms. Elemental maps were measured in ‘High dose’ mode and based on detector no. 5 (XIA05) only. All element maps were normalized to dead time, ring current and quantified using the Fundamental Parameter method, taking into account the ice layer thickness determined using the K-Kα/Kβ ratio. Red striped circles indicate areas with iron hot-spots, circles h1-h3 indicate exogenous iron hot-spots, white arrows spherical structures and red arrows fibre-like structures in the fibroblast cells.

