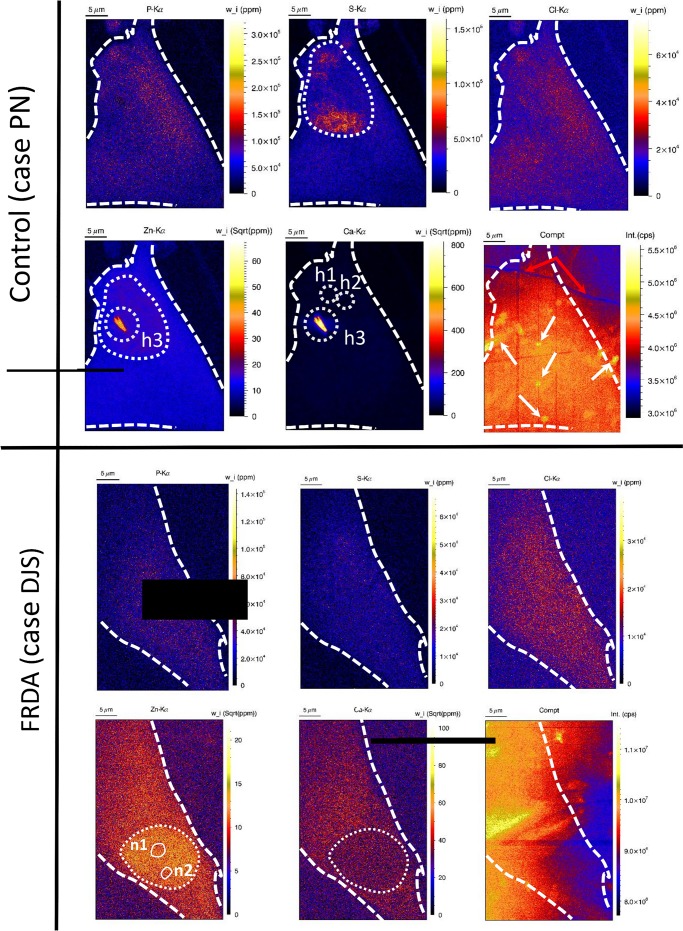
Fig 3. Elemental distribution of P, S, Cl, Ca, Zn and Compton scatter within control fibroblast case ‘PN’ (upper row) and FRDA fibroblast case ‘DJS’ (lower row).
Experimental conditions: see legend of Fig 2. White dashed circle indicates the nucleus border. n1-2 indicate the presence of nucleoli.

