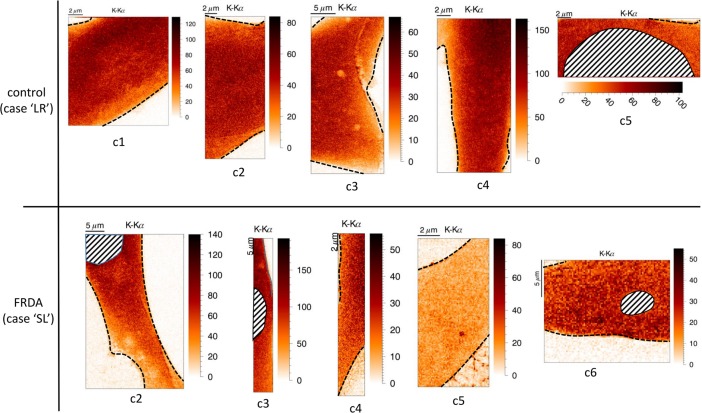
Fig 4. Potassium elemental distribution of (parts of) single fibroblast cells obtained from control patient ‘LR’ and Friedreich’s ataxia patient ‘SL’.
For each case, 5 different fibroblasts were scanned. Boundaries of the fibroblasts are indicated, as well as their nuclei (if present). Scans were obtained in ‘Low Dose’ mode, with a step size of 100 nm and a dwell time of 50 ms. Maps are normalized to incoming intensity, 1s measuring time and are dead time corrected.

