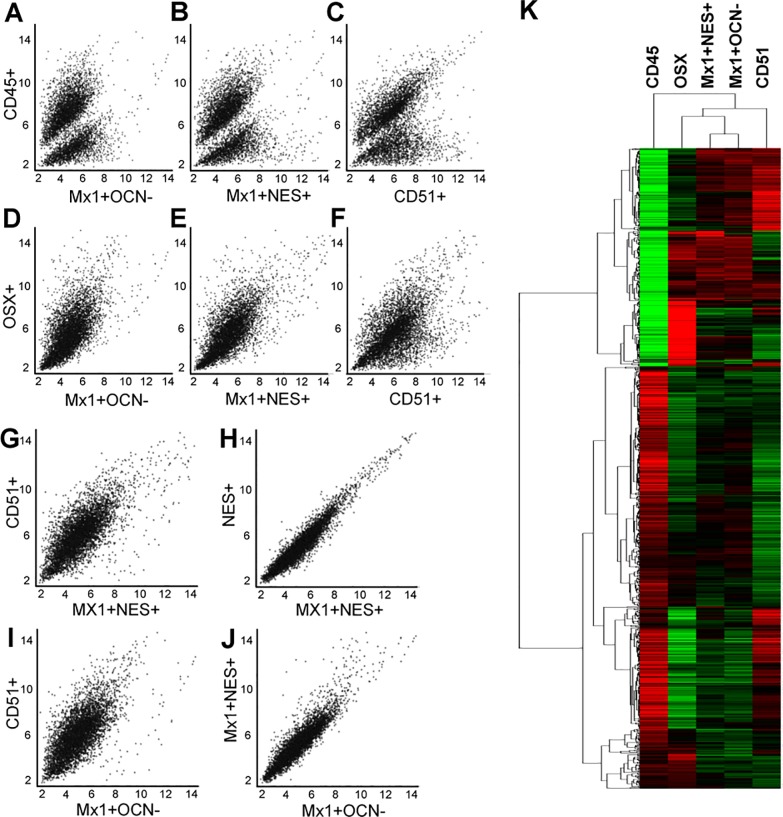
Fig 2. Commonly used markers for BM-SSCs yield a heterogeneous mixture, but are similar to P-SSCs.
(A-C) Scatter plot comparison between Mx1+Ocn− P-SSCs (A), Mx1+Nes+ BM-SSCs (B), and CD51+ BMSCs (C) with CD45+ cells, demonstrates that these populations are likewise different from CD45+ hematopoietic cells from the BM compartment. (D-F) Scatter plot comparison between Mx1+Ocn− P-SSCs (D), Mx1+Nes+ BM-SSCs (E), and CD51+ BMSCs (F) with Osx+ osteoprogenitor cells shows that each of these populations are more functionally similar to the osteolineage cells. (G) Direct comparison between CD51+ BMSCs and Mx1+Nes+ BM-SSCs demonstrates that these two commonly used selection markers for BM-SSCs yield a heterogeneous mixture of cells. (H) Mx1+Nes+ BM-SSCs and Nes+ cells are essentially the same population of cells. (I & J) Comparing Mx1+Ocn− P-SSCs with CD51+ BMSCs (I) shows that these are functionally different cell-populations, but comparison with Mx1+Nes+ BM-SSCs (J) shows few differences. (K) Cluster analysis of these cell populations confirms scatter plot analysis and shows that Mx1+Ocn− P-SSCs and Mx1+Nes+ BM-SSCs cluster together, but each of these populations are distinct from CD51+ BMSCs (p < 0.05).

