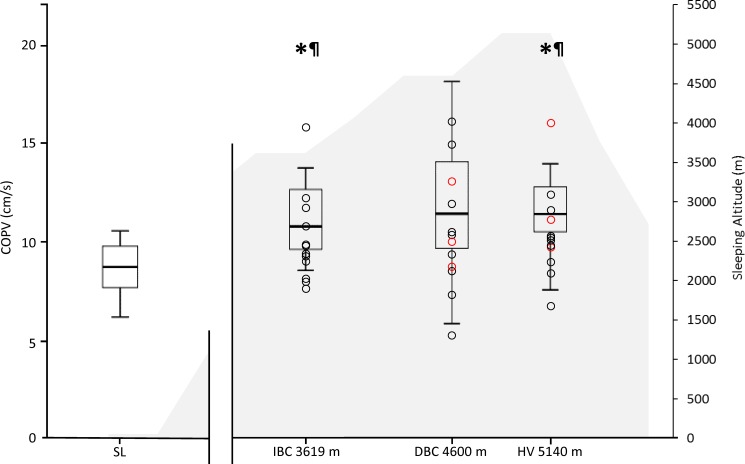
Fig 3. Centre of pressure total sway velocity (cm/s) for standing balance with eyes open along with altitude profile.
Box plots show medians, quartiles, whiskers representing the max and min values, and dots representing individual participant values (O = positive LLS in 24 hrs before test). *p<0.05 vs. SL, ¶Cohen’s d > 0.8 compared with sea level.

